
Page 207 - Geochemical Remote Sensing of The Sub-Surface
P. 207
184 V.T. Jones, M.D. Matthews and D.M. Richers
Lineament Center
9 ..,h ...ue /// B
Station
Background x /
x Station /x x/
/ Fracture /,/~X//r
Distance from
Lineament canter ~
t
/ i oOoo o"'o"'"
,.;o. ".-;"
Distance from
Lineament center v
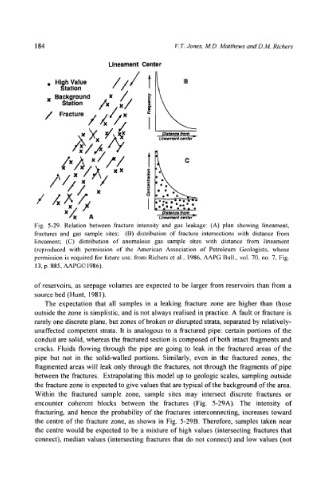
Fig. 5-29. Relation between fracture intensity and gas leakage: (A) plan showing lineament,
fractures and gas sample sites; (B) distribution of fracture intersections with distance from
lineament; (C) distribution of anomalous gas sample sites with distance from lineament
(reproduced with permission of the American Association of Petroleum Geologists, whose
permission is required for future use, from Richers et al., 1986, AAPG Bull., vol. 70, no. 7, Fig.
13, p. 885, AAPG 9 1986).
of reservoirs, as seepage volumes are expected to be larger from reservoirs than from a
source bed (Hunt, 1981).
The expectation that all samples in a leaking fracture zone are higher than those
outside the zone is simplistic, and is not always realised in practice. A fault or fracture is
rarely one discrete plane, but zones of broken or disrupted strata, separated by relatively-
unaffected competent strata. It is analogous to a fractured pipe: certain portions of the
conduit are solid, whereas the fractured section is composed of both intact fragments and
cracks. Fluids flowing through the pipe are going to leak in the fractured areas of the
pipe but not in the solid-walled portions. Similarly, even in the fractured zones, the
fragmented areas will leak only through the fractures, not through the fragments of pipe
between the fractures. Extrapolating this model up to geologic scales, sampling outside
the fracture zone is expected to give values that are typical of the background of the area.
Within the fractured sample zone, sample sites may intersect discrete fractures or
encounter coherent blocks between the fractures (Fig. 5-29A). The intensity of
fracturing, and hence the probability of the fractures interconnecting, increases toward
the centre of the fracture zone, as shown in Fig. 5-29B. Therefore, samples taken near
the centre would be expected to be a mixture of high values (intersecting fractures that
connect), median values (intersecting fractures that do not connect) and low values (not