
Page 213 - Geochemical Remote Sensing of The Sub-Surface
P. 213
190 V.T. Jones, M.D. Matthews and D.M. Richers
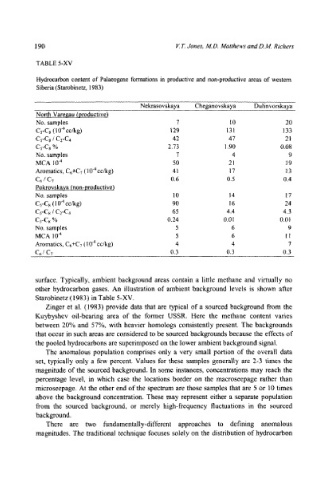
TABLE 5-XV
Hydrocarbon content of Palaeogene formations in productive and non,productive areas of western
Siberia (Starobinetz, 1983)
Nekrasovskaya Cheganovskaya Dulinvorskaya
Nort_h Varegau (productive)
No. samples 7 10 20
C~-C8 (I 0 "4 cc/kg) 129 131 133
C5-Cs / Cz-C4 42 47 21
Cs-Cs % 2.73 1.90 0.08
No. samples 7 4 9
MCA l 0 "4 50 21 19
Aromatics, C6+C7 (I 0 4 cc/kg) 41 17 13
C6 / C7 0.6 0.5 0.4
Pokrpvskaya (non-productive)
No. samples 10 14 17
C5-C~ (10 "4 cc/kg) 90 16 24
Cs-Cs / C2-C4 65 4.4 4.3
Cs-Cs % 0.24 0,01 0.01
No. samples 5 6 9
MCA 10 -4 5 6 11
Aromatics, C6+C7 (10 .4 cc/kg) 4 4 7
C6 / C7 0.3 0.3 0.3
surface. Typically, ambient background areas contain a little methane and virtually no
other hydrocarbon gases. An illustration of ambient background levels is shown after
Starobinetz (1983) in Table 5-XV.
Zinger et al. (1983) provide data that are typical of a sourced background from the
Kuybyshev oil-bearing area of the former USSR. Here the methane content varies
between 20% and 57%, with heavier homologs consistently present. The backgrounds
that occur in such areas are considered to be sourced backgrounds because the effects of
the pooled hydrocarbons are superimposed on the lower ambient background signal.
The anomalous population comprises only a very small portion of the overall data
set, typically only a few percent. Values for these samples generally are 2-3 times the
magnitude of the sourced background. In some instances, concentrations may reach the
percentage level, in which case the locations border on the macroseepage rather than
microseepage. At the other end of the spectrum are those samples that are 5 or 10 times
above the background concentration. These may represent either a separate population
from the sourced background, or merely high-frequency fluctuations in the sourced
background.
There are two fundamentally-different approaches to defining anomalous
magnitudes. The traditional technique focuses solely on the distribution of hydrocarbon