
Page 216 - Geochemical Remote Sensing of The Sub-Surface
P. 216
Light hydrocarbons for petroleum and gas prospecting 193
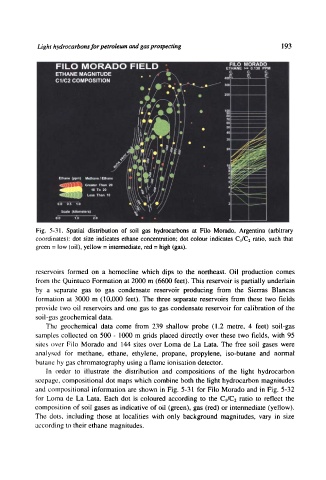
Fig. 5-31. Spatial distribution of soil gas hydrocarbons at Filo Morado, Argentina (arbitrary
coordinates): dot size indicates ethane concentration; dot colour indicates CI/C2 ratio, such that
green = low (oil), yellow = intermediate, red = high (gas).
reservoirs formed on a homocline which dips to the northeast. Oil production comes
from the Quintuco Formation at 2000 m (6600 feet). This reservoir is partially underlain
by a separate gas to gas condensate reservoir producing from the Sierras Blancas
formation at 3000 m (10,000 feet). The three separate reservoirs from these two fields
provide two oil reservoirs and one gas to gas condensate reservoir for calibration of the
soil-gas geochemical data.
The geochemical data come from 239 shallow probe (1.2 metre, 4 feet) soil-gas
samples collected on 500 - 1000 m grids placed directly over these two fields, with 95
sites over Filo Morado and 144 sites over Loma de La Lata. The free soil gases were
analysed for methane, ethane, ethylene, propane, propylene, iso-butane and normal
butanc by gas chromatography using a flame ionisation detector.
In order to illustrate the distribution and compositions of the light hydrocarbon
seepage, compositional dot maps which combine both the light hydrocarbon magnitudes
and compositional information are shown in Fig. 5-31 for Filo Morado and in Fig. 5-32
for Loma de La Lata. Each dot is coloured according to the C~/C2 ratio to reflect the
composition of soil gases as indicative of oil (green), gas (red) or intermediate (yellow).
The dots, including those at localities with only background magnitudes, vary in size
according to their ethane magnitudes.