
Page 217 - Geochemical Remote Sensing of The Sub-Surface
P. 217
194 V.T. Jones, M.D. Matthews and D.M. Richers
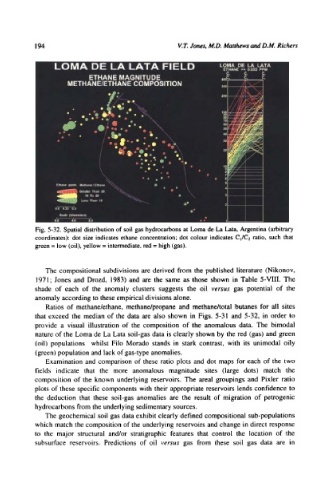
Fig. 5-32. Spatial distribution of soil gas hydrocarbons at Loma de La Lata, Argentina (arbitrary
coordinates): dot size indicates ethane concentration; dot colour indicates CJC2 ratio, such that
green = low (oil), yellow = intermediate, red = high (gas).
The compositional subdivisions are derived from the published literature (Nikonov,
1971; Jones and Drozd, 1983) and are the same as those shown in Table 5-VIII. The
shade of each of the anomaly clusters suggests the oil versus gas potential of the
anomaly according to these empirical divisions alone.
Ratios of methane/ethane, methane/propane and methane/total butanes for all sites
that exceed the median of the data are also shown in Figs. 5-31 and 5-32, in order to
provide a visual illustration of the composition of the anomalous data. The bimodal
nature of the Loma de La Lata soil-gas data is clearly shown by the red (gas) and green
(oil) populations whilst Filo Morado stands in stark contrast, with its unimodal oily
(green) population and lack of gas-type anomalies.
Examination and comparison of these ratio plots and dot maps for each of the two
fields indicate that the more anomalous magnitude sites (large dots) match the
composition of the known underlying reservoirs. The areal groupings and Pixler ratio
plots of these specific components with their appropriate reservoirs lends confidence to
the deduction that these soil-gas anomalies are the result of migration of petrogenic
hydrocarbons from the underlying sedimentary sources.
The geochemical soil gas data exhibit clearly defined compositional sub-populations
which match the composition of the underlying reservoirs and change in direct response
to the major structural and/or stratigraphic features that control the location of the
subsurface reservoirs. Predictions of oil versus gas from these soil gas data are in