
Page 51 - Geochemical Remote Sensing of The Sub-Surface
P. 51
28 O.F. Putikov and B. Wen
metals from the solid phase to the liquid phase means transformation of confined forms
of metals to mobile forms. Many studies have shown that in the water in the vicinity of
ore bodies concentrations of metals is higher than elsewhere. For example, background
concentrations (Cb~) and anomalous concentrations (C,,) in oxidised polymetallic
sulphide deposits are Cba -" 8-50 pg/1 Cu 2+, 5-8 pg/1 Pb 2+ and 10-30 pg/1 Zn 2+ , Can -- 500-
20000 pg/1 Cu 2+, 10-20 lag/l PbZ+and 50-1500 pg/1 Zn 2§ In the case of unoxidised
polymetallic sulphide deposits, Cb~ = 5-7 btg/1 Cu 2+, 4-6 btg/1 Pb 2+ and 5-35 pg/1 Zn 2+, Ca.
= 10-140 ~tg/l Cu , 12-30 ~g/1 Pb 2§ and 35-700 btg/1 Zn 2§ (Goleva, 1977). Oil and gas
2+
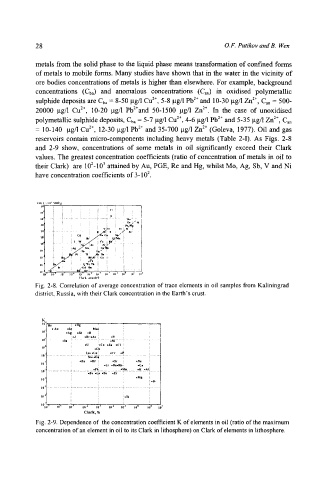
reservoirs contain micro-components including heavy metals (Table 2-I). As Figs. 2-8
and 2-9 show, concentrations of some metals in oil significantly exceed their Clark
values. The greatest concentration coefficients (ratio of concentration of metals in oil to
their Clark) are 102-103 attained by Au, PGE, Re and Hg, whilst Mo, Ag, Sb, V and Ni
have concentration coefficients of 3-102.
()ll. C. I0' MOI/g
I I1~ !
ill ~ i CI
lit ~ ..... : ..... i .............. ~ ..... ' : ............... , ............. ; "NI': ....
S
'. i V rr : TI : 4K :
lW .... ! ............... ! ...... : " ! .... ~ ~ ? v + .... ,,.( A~"
! : cd '/4., c~ isc, / i :
io' i i i ' n,': I/'.: : 0?~, i
W .~.Z-..::.,C'._., ~.>
:
i i
!
lip . : ! ....... : ...... : ...... !.,.. !A, .... : .... i }~ .... : ..... : ! ............ 9
,,,, i i A , ~ ~ ' C ~ b : i :
! i i.5"~ ! ~:.+" ! ! ! :
i . i : ,4. (':, ! i : i !
' " ~ ' o ' 4 ~ ~" ~,i .... !. i; ....... : ......
9 ltf I IO" lO 4' I()" Ill ~ 1[I ~ Ill " Ill i lllU lllJ lilt
("lark. alOlllJfe~
Fig. 2-8. Correlation of average concentration of trace elements in oil samples from Kaliningrad
district, Russia, with their Clark concentration in the Earth's crust.
K
ll)J 'Re " -lll ! . . . . .
* Au *S~ Mo~
10~ *Ag ,Sb ,B
i *J ,Br ,As ,V
tO' .ln : ................. *N[ .............................
,U !,Co ,Zn -CI
I II (' 9 9 ~u
Cs- .C. ! ,Cr -~
lid ............................ $~i'i~i ................. : .........................
-Eu ,Hf : *St : *Ns
IO : eLl ,BaoRb ' ,Cs
-PI~ -Mn -K .,AI
u) - ......................... ;iii;i~;;s;;,~,: ....................... ! .......
iOa -MI i
: ' -St
Ill" ................................... i .................................... i .......
I 0 ~ ,TI :
1010"7 Ill' !0 "'~ 10 .4 I0 J 10 4 IO -I I00 Ill I 102
Clark, %
Fig. 2-9. Dependence of the concentration coefficient K of elements in oil (ratio of the maximum
concentration of an element in oil to its Clark in lithosphere) on Clark of elements in lithosphere.