
Page 54 - Geochemical Remote Sensing of The Sub-Surface
P. 54
Geoelectrochemistry and stream dispersion 31
A B
C-Cf, mg/l C-Cf, rag/1
0 0.2 0.4 0 0.2 0.4
:li .....
25 H20 2~
50 50 [.1 ",1 ", ;~
CuIO4
air air
75 75
h, cm h cm
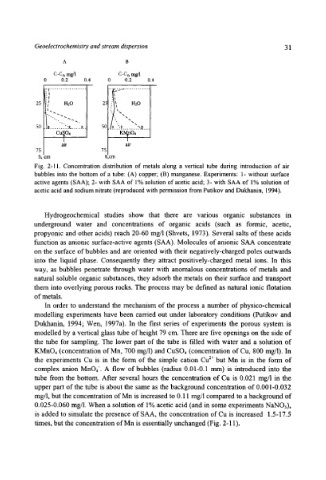
Fig. 2-11. Concentration distribution of metals along a vertical tube during introduction of air
bubbles into the bottom of a tube: (A) copper; (B) manganese. Experiments: 1- without surface
active agents (SAA); 2- with SAA of 1% solution of acetic acid; 3- with SAA of 1% solution of
acetic acid and sodium nitrate (reproduced with permission from Putikov and Dukhanin, 1994).
Hydrogeochemical studies show that there are various organic substances in
underground water and concentrations of organic acids (such as formic, acetic,
propyonic and other acids) reach 20-60 mg/1 (Shvets, 1973). Several salts of these acids
function as anionic surface-active agents (SAA). Molecules of anionic SAA concentrate
on the surface of bubbles and are oriented with their negatively-charged poles outwards
into the liquid phase. Consequently they attract positively-charged metal ions. In this
way, as bubbles penetrate through water with anomalous concentrations of metals and
natural soluble organic substances, they adsorb the metals on their surface and transport
them into overlying porous rocks. The process may be defined as natural ionic flotation
of metals.
In order to understand the mechanism of the process a number of physico-chemical
modelling experiments have been carried out under laboratory conditions (Putikov and
Dukhanin, 1994; Wen, 1997a). In the first series of experiments the porous system is
modelled by a vertical glass tube of height 79 cm. There are five openings on the side of
the tube for sampling. The lower part of the tube is filled with water and a solution of
KMnO4 (concentration of Mn, 700 mg/1) and CuSO4 (concentration of Cu, 800 mg/l). In
the experiments Cu is in the form of the simple cation Cu 2+ but Mn is in the form of
complex anion MnO4-. A flow of bubbles (radius 0.01-0.1 mm) is introduced into the
tube from the bottom. After several hours the concentration of Cu is 0.021 mg/1 in the
upper part of the tube is about the same as the background concentration of 0.001-0.032
mg/l, but the concentration of Mn is increased to 0.11 mg/l compared to a background of
0.025-0.060 mg/1. When a solution of 1% acetic acid (and in some experiments NaNO3),
is added to simulate the presence of SAA, the concentration of Cu is increased 1.5-17.5
times, but the concentration of Mn is essentially unchanged (Fig. 2-11).