
Page 73 - Geochemical Remote Sensing of The Sub-Surface
P. 73
50 O.F. Putikov and B. Wen
C ~tg/ml
12
9 Cu Fe
/ l
6
3 ' - ~ - ~ ~ ~ i
o
1 5 10 15
0 O0
llf I 21J-' I ~ ~ ,50m,
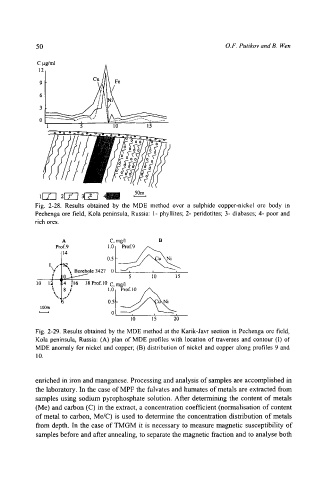
Fig. 2-28. Results obtained by the MDE method over a sulphide copper-nickel ore body in
Pechenga ore field, Kola peninsula, Russia: 1- phyllites; 2- peridotites; 3- diabases; 4- poor and
rich ores.
A C, mg/1 B
'V'I 9
1o ,,
4 j16 18Prof.tO C, mg/I
1~ 1
% , .,.'
100m
t-----t
i I i
10 15 20
Fig. 2-29. Results obtained by the MDE method at the Karik-Javr section in Pechenga ore field,
Kola peninsula, Russia: (A) plan of MDE profiles with location of traverses and contour (I) of
MDE anomaly for nickel and copper; (B) distribution of nickel and copper along profiles 9 and
10.
enriched in iron and manganese. Processing and analysis of samples are accomplished in
the laboratory. In the case of MPF the fulvates and humates of metals are extracted from
samples using sodium pyrophosphate solution. After determining the content of metals
(Me) and carbon (C) in the extract, a concentration coefficient (normalisation of content
of metal to carbon, Me/C) is used to determine the concentration distribution of metals
from depth. In the case of TMGM it is necessary to measure magnetic susceptibility of
samples before and after annealing, to separate the magnetic fraction and to analyse both