
Page 74 - Geochemical Remote Sensing of The Sub-Surface
P. 74
Geoelectrochemistry and stream dispersion 51
Geol. Diagrams of logging
section 3.~u C~zrent.mA ~. CGS 9 diameter, rr~
O. 10 20 30 o. ;o ;o o o.~.,o-, 60 100 de
o ~ ~,-* :,-
.-+.- f
._<--
i
25 ~_. ----~
50 p'v ~v
75
!
...... i
h,m
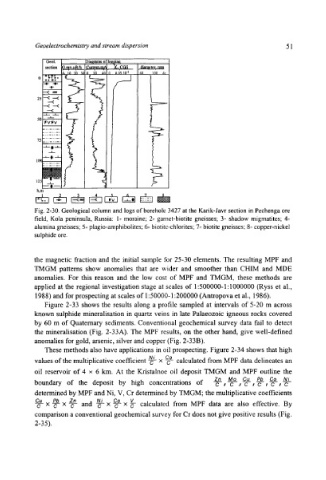
Fig. 2-30. Geological column and logs of borehole 3427 at the Karik-Javr section in Pechenga ore
field, Kola peninsula, Russia: 1- moraine; 2- garnet-biotite gneisses; 3- shadow migmatites; 4-
alumina gneisses; 5- plagio-amphibolites; 6- biotitc-chlorites; 7- biotite gneisses; 8- copper-nickel
sulphide ore.
the magnetic fraction and the initial sample for 25-30 elements. The resulting MPF and
TMGM patterns show anomalies that are wider and smoother than CHIM and MDE
anomalies. For this reason and the low cost of MPF and TMGM, these methods are
applied at the regional investigation stage at scales of 1:500000-1:1000000 (Ryss et al.,
1988) and for prospecting at scales of 1:50000-1:200000 (Antropova et al., 1986).
Figure 2-33 shows the results along a profile sampled at intervals of 5-20 m across
known sulphide mineralisation in quartz veins in late Palaeozoic igneous rocks covered
by 60 m of Quaternary sediments. Conventional geochemical survey data fail to detect
the mineralisation (Fig. 2-33A). The MPF results, on the other hand, give well-defined
anomalies for gold, arsenic, silver and copper (Fig. 2-33B).
These methods also have applications in oil prospecting. Figure 2-34 shows that high
Ni Co
values of the multiplicative coefficient -6- x -~- calculated from MPF data delineates an
oil reservoir of 4 • 6 km. At the Kristalnoe oil deposit TMGM and MPF outline the
Zn
Pb
Co
Mo
Co
boundary of the deposit by high concentrations of -~-, c ~ -~-, ~- ~ -6- ~ Ni
determined by MPF and Ni, V, Cr determined by TMGM; the multiplicative coefficients
Cu Ni Co
-'6-" x --~ x --~ and -if- x -~- x ~- calculated from MPF data are also effective. By
comparison a conventional geochemical survey for Cr does not give positive results (Fig.
2-35).