
Page 77 - Geochemical Remote Sensing of The Sub-Surface
P. 77
54 O.F. Putikov and B. Wen
km
(Ni/C ~2o/C)'10"
10'-
,~ t
ot
8
6-
4-
2-
0 i I i i /
2 4 6 8 1 o
kin
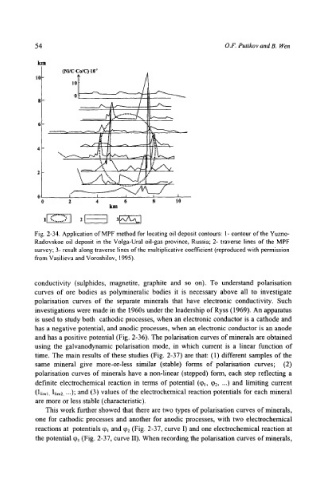
Fig. 2-34. Application of MPF method for locating oil deposit contours: 1- contour of the Yuzno-
Radovskoe oil deposit in the Voiga-Ural oil-gas province, Russia; 2- traverse lines of the MPF
survey; 3- result along traverse lines of the multiplicative coefficient (reproduced with permission
from Vasilieva and Voroshilov, 1995).
conductivity (sulphides, magnetite, graphite and so on). To understand polarisation
curves of ore bodies as polymineralic bodies it is necessary above all to investigate
polarisation curves of the separate minerals that have electronic conductivity. Such
investigations were made in the 1960s under the leadership of Ryss (1969). An apparatus
is used to study both cathodic processes, when an electronic conductor is a cathode and
has a negative potential, and anodic processes, when an electronic conductor is an anode
and has a positive potential (Fig. 2-36). The polarisation curves of minerals are obtained
using the galvanodynamic polarisation mode, in which current is a linear function of
time. The main results of these studies (Fig. 2-37) are that: (1) different samples of the
same mineral give more-or-less similar (stable) forms of polarisation curves; (2)
polarisation curves of minerals have a non-linear (stepped) form, each step reflecting a
definite electrochemical reaction in terms of potential (q~, q~2 .... ) and limiting current
(Iliml, llim2,--.), and (3) values of the electrochemical reaction potentials for each mineral
are more or less stable (characteristic).
This work further showed that there are two types of polarisation curves of minerals,
one for cathodic processes and another for anodic processes, with two electrochemical
reactions at potentials q~ and q~2 (Fig. 2-37, curve I) and one electrochemical reaction at
the potential q~! (Fig. 2-37, curve II). When recording the polarisation curves of minerals,