
Page 79 - Geochemical Remote Sensing of The Sub-Surface
P. 79
56 O.F. Putikov and B. Wen
I A
q~
A(M)
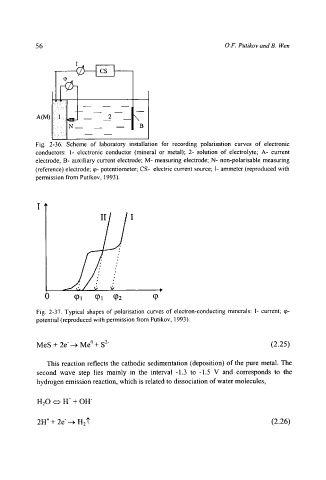
Fig. 2-36. Scheme of laboratory installation for recording polarisation curves of electronic
conductors: 1- electronic conductor (mineral or metal); 2- solution of electrolyte; A- current
electrode; B- auxiliary current electrode; M- measuring electrode; N- non-polarisable measuring
(reference) electrode; q~- potentiometer; CS- electric current source; I- ammeter (reproduced with
permission from Putikov, 1993).
II I
0 q~l q)l q0z q~
Fig. 2-37. Typical shapes of polarisation curves of electron-conducting minerals: I- current; q0-
potential (reproduced with permission from Putikov, 1993).
MeS + 2e----~ Me~ S 2" (2.25)
This reaction reflects the cathodic sedimentation (deposition) of the pure metal. The
second wave step lies mainly in the interval-1.3 to -1.5 V and corresponds to the
hydrogen emission reaction, which is related to dissociation of water molecules,
H20 r H + + OH-
2H + + 2e---~ H2']" (2.26)