
Page 94 - Geochemical Remote Sensing of The Sub-Surface
P. 94
Geoelectrochemistry and stream dispersion 71
T'? '" +'
ACI A A0 A A
iI .... I 1
...............
i i Ill|re.C] ---q,-~ .......... , =.A/ !
.................... 4%
i t
C A
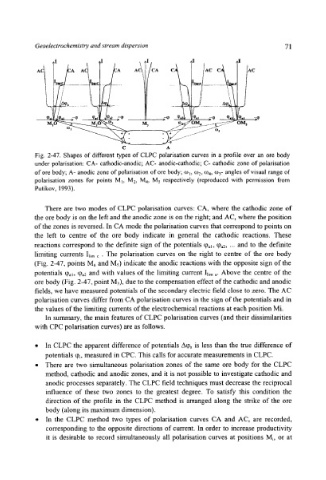
Fig. 2-47. Shapes of different types of CLPC polarisation curves in a profile over an ore body
under polarisation: CA- cathodic-anodic; AC- anodic-cathodic; C- cathodic zone of polarisation
of ore body; A- anodic zone of polarisation of ore body; o~, co2, oJ4, co5- angles of visual range of
polarisation zones for points M~, M2, M4, M5 respectively (reproduced with permission from
Putikov, 1993).
There are two modes of CLPC polarisation curves: CA, where the cathodic zone of
the ore body is on the left and the anodic zone is on the right; and AC, where the position
of the zones is reversed. In CA mode the polarisation curves that correspond to points on
the left to centre of the ore body indicate in general the cathodic reactions. These
reactions correspond to the defmite sign of the potentials (Pal, (Pa2, "" and to the definite
limiting currents I~m c 9 The polarisation curves on the right to centre of the ore body
(Fig. 2-47, points M4 and Ms) indicate the anodic reactions with the opposite sign of the
potentials (P.~, (P.~2 and with values of the limiting current Ilim a- Above the centre of the
ore body (Fig. 2-47, point M3), due to the compensation effect of the cathodic and anodic
fields, we have measured potentials of the secondary electric field close to zero. The AC
polarisation curves differ from CA polarisation curves in the sign of the potentials and in
the values of the limiting currents of the electrochemical reactions at each position Mi.
In summary, the main features of CLPC polarisation curves (and their dissimilarities
with CPC polarisation curves) are as follows.
9 In CLPC the apparent difference of potentials A(p, is less than the true difference of
potentials %, measured in CPC. This calls for accurate measurements in CLPC.
9 There are two simultaneous polarisation zones of the same ore body for the CLPC
method, cathodic and anodic zones, and it is not possible to investigate cathodic and
anodic processes separately. The CLPC field techniques must decrease the reciprocal
influence of these two zones to the greatest degree. To satisfy this condition the
direction of the profile in the CLPC method is arranged along the strike of the ore
body (along its maximum dimension).
9 In the CLPC method two types of polarisation curves CA and AC, are recorded,
corresponding to the opposite directions of current. In order to increase productivity
it is desirable to record simultaneously all polarisation curves at positions Mi, or at