
Page 95 - Geochemical Remote Sensing of The Sub-Surface
P. 95
72 O.F. Putikov and B. Wen
Ac Is A I,A A
I,A
ZSZ
o~2 0 -0,5 r 0.2 0 ~ -0,5 ~0,V
,l'x%lf mV B
sialce'l'l 1:2 1'3 14 1'5 16 1~/ 18
IA%l,mV
~l~ro ....
~301 . . .~,~ ..
50 100 200 300 Y'~,7"
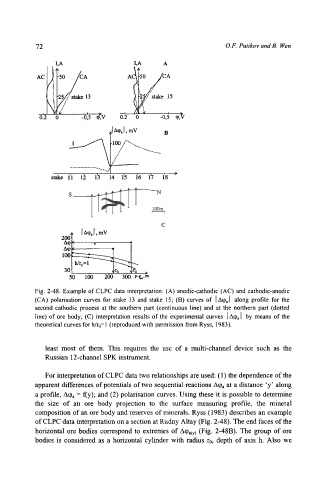
Fig. 2-48. Example of CLPC data interpretation: (A) anodic-cathodic (AC) and cathodic-anodic
(CA) polarisation curves for stake 13 and stake 15; (B) curves of ]Aq~a[ along profile for the
second cathodic process at the southern part (continuous line) and at the northern part (dotted
line) of ore body; (C) interpretation results of the experimental curves I Aq)a ] by means of the
theoretical curves for h/r0 = 1 (reproduced with permission from Ryss, 1983).
least most of them. This requires the use of a multi-channel device such as the
Russian 12-channel SPK instrument.
For interpretation of CLPC data two relationships are used: (1) the dependence of the
apparent differences of potentials of two sequential reactions Aq~a at a distance 'y' along
a profile, Aq~a = f(y); and (2) polarisation curves. Using these it is possible to determine
the size of an ore body projection to the surface measuring profile, the mineral
composition of an ore body and reserves of minerals. Ryss (1983) describes an example
of CLPC data interpretation on a section at Rudny Altay (Fig. 2-48). The end faces of the
horizontal ore bodies correspond to extremes of Aq)a(y ) (Fig. 2-48B). The group of ore
bodies is considered as a horizontal cylinder with radius r0, depth of axis h. Also we