
Page 230 - Geochemistry of Oil Field Waters
P. 230
COMPOSITION OF OILFIELD WATERS 217
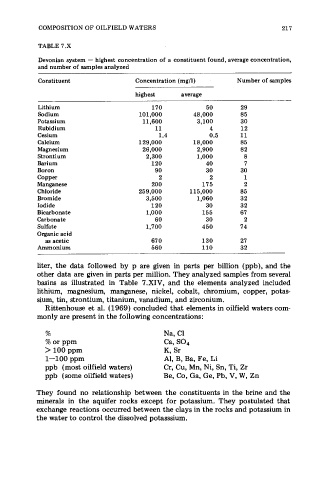
TABLE 7.X
Devonian system - highest concentration of a constituent found, average concentration,
and number of samples analyzed
Constituent Concentration (mg/l) Number of samples
highest average
~~
Lit hi um 170 50 29
Sodium 101,000 48,000 85
Potassium 11,600 3,100 30
Rubidium 11 4 12
Cesium 1.4 0.5 11
Calcium 129,000 18,000 85
Magnesium 26,000 2,900 82
Strontium 2,300 1,000 8
Barium 120 40 7
Boron 90 30 30
Copper 2 2 1
Manganese 200 175 2
Chloride 259,000 115,000 85
Bromide 3,500 1,060 32
Iodide 120 30 32
Bicarbonate 1,000 155 67
Carbonate 60 30 2
Sulfate 1,700 450 74
Organic acid
as acetic 67 0 130 27
Ammonium 560 110 32
liter, the data followed by p are given in parts per billion (ppb), and the
other data are given in parts per million. They analyzed samples from several
basins as illustrated in Table 7.XIV, and the elements analyzed included
lithium, magnesium, manganese, nickel, cobalt, chromium, copper, potas-
sium, tin, strontium, titanium, vanadium, and zirconium.
Rittenhouse et al. (1969) concluded that elements in oilfield waters com-
monly are present in the following concentrations:
5% Na, C1
5% or ppm Ca, SO4
> 100 ppm K, Sr
1-100 ppm Al, B, Ba, Fe, Li
ppb (most oilfield waters) Cr, Cu, Mn, Ni, Sn, Ti, Zr
ppb (some oilfield waters) Be, Co, Ga, Ge, Pb, V, W, Zn
They found no relationship between the constituents in the brine and the
minerals in the aquifer rocks except for potassium. They postulated that
exchange reactions occurred between the clays in the rocks and potassium in
the water to control the dissolved potasssium.