
Page 107 - Geothermal Energy Renewable Energy and The Environment
P. 107
Exploring for Geothermal Systems 93
Fluid flow
Fluid flow pathways
30 km 40 km
pathways
Thermal zone
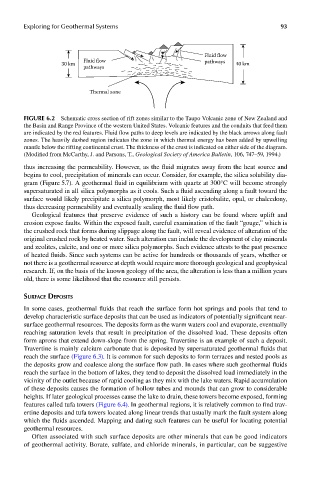
FIGUre 6.2 Schematic cross section of rift zones similar to the Taupo Volcanic zone of New Zealand and
the Basin and Range Province of the western United States. Volcanic features and the conduits that feed them
are indicated by the red features. Fluid flow paths to deep levels are indicated by the black arrows along fault
zones. The heavily dashed region indicates the zone in which thermal energy has been added by upwelling
mantle below the rifting continental crust. The thickness of the crust is indicated on either side of the diagram.
(Modified from McCarthy, J. and Parsons, T., Geological Society of America Bulletin, 106, 747–59, 1994.)
thus increasing the permeability. However, as the fluid migrates away from the heat source and
begins to cool, precipitation of minerals can occur. Consider, for example, the silica solubility dia-
gram (Figure 5.7). A geothermal fluid in equilibrium with quartz at 300°C will become strongly
supersaturated in all silica polymorphs as it cools. Such a fluid ascending along a fault toward the
surface would likely precipitate a silica polymorph, most likely cristobalite, opal, or chalcedony,
thus decreasing permeability and eventually sealing the fluid flow path.
Geological features that preserve evidence of such a history can be found where uplift and
erosion expose faults. Within the exposed fault, careful examination of the fault “gouge,” which is
the crushed rock that forms during slippage along the fault, will reveal evidence of alteration of the
original crushed rock by heated water. Such alteration can include the development of clay minerals
and zeolites, calcite, and one or more silica polymorphs. Such evidence attests to the past presence
of heated fluids. Since such systems can be active for hundreds or thousands of years, whether or
not there is a geothermal resource at depth would require more thorough geological and geophysical
research. If, on the basis of the known geology of the area, the alteration is less than a million years
old, there is some likelihood that the resource still persists.
surface deposiTs
In some cases, geothermal fluids that reach the surface form hot springs and pools that tend to
develop characteristic surface deposits that can be used as indicators of potentially significant near-
surface geothermal resources. The deposits form as the warm waters cool and evaporate, eventually
reaching saturation levels that result in precipitation of the dissolved load. These deposits often
form aprons that extend down-slope from the spring. Travertine is an example of such a deposit.
Travertine is mainly calcium carbonate that is deposited by supersaturated geothermal fluids that
reach the surface (Figure 6.3). It is common for such deposits to form terraces and nested pools as
the deposits grow and coalesce along the surface flow path. In cases where such geothermal fluids
reach the surface in the bottom of lakes, they tend to deposit the dissolved load immediately in the
vicinity of the outlet because of rapid cooling as they mix with the lake waters. Rapid accumulation
of these deposits causes the formation of hollow tubes and mounds that can grow to considerable
heights. If later geological processes cause the lake to drain, these towers become exposed, forming
features called tufa towers (Figure 6.4). In geothermal regions, it is relatively common to find trav-
ertine deposits and tufa towers located along linear trends that usually mark the fault system along
which the fluids ascended. Mapping and dating such features can be useful for locating potential
geothermal resources.
Often associated with such surface deposits are other minerals that can be good indicators
of geothermal activity. Borate, sulfate, and chloride minerals, in particular, can be suggestive