
Page 110 - Geothermal Energy Renewable Energy and The Environment
P. 110
96 Geothermal Energy: Renewable Energy and the Environment
Table 6.2
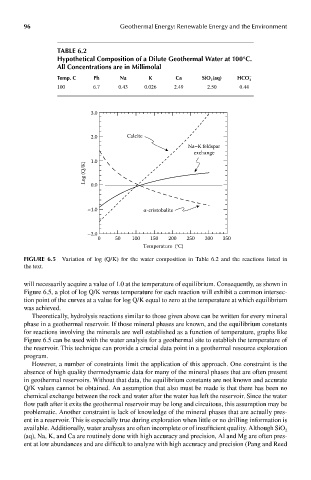
hypothetical composition of a dilute Geothermal water at 100°c.
all concentrations are in millimolal
Temp. c ph na k ca sio 2 (aq) hco 3 −
100 6.7 0.43 0.026 2.49 2.50 0.44
3.0
2.0 Calcite
Na–K feldspar
exchange
1.0
Log (Q/K) 0.0
–1.0 α-cristobalite
–2.0
0 50 100 150 200 250 300 350
Temperature (°C)
FIGUre 6.5 Variation of log (Q/K) for the water composition in Table 6.2 and the reactions listed in
the text.
will necessarily acquire a value of 1.0 at the temperature of equilibrium. Consequently, as shown in
Figure 6.5, a plot of log Q/K versus temperature for each reaction will exhibit a common intersec-
tion point of the curves at a value for log Q/K equal to zero at the temperature at which equilibrium
was achieved.
Theoretically, hydrolysis reactions similar to those given above can be written for every mineral
phase in a geothermal reservoir. If those mineral phases are known, and the equilibrium constants
for reactions involving the minerals are well established as a function of temperature, graphs like
Figure 6.5 can be used with the water analysis for a geothermal site to establish the temperature of
the reservoir. This technique can provide a crucial data point in a geothermal resource exploration
program.
However, a number of constraints limit the application of this approach. One constraint is the
absence of high quality thermodynamic data for many of the mineral phases that are often present
in geothermal reservoirs. Without that data, the equilibrium constants are not known and accurate
Q/K values cannot be obtained. An assumption that also must be made is that there has been no
chemical exchange between the rock and water after the water has left the reservoir. Since the water
flow path after it exits the geothermal reservoir may be long and circuitous, this assumption may be
problematic. Another constraint is lack of knowledge of the mineral phases that are actually pres-
ent in a reservoir. This is especially true during exploration when little or no drilling information is
available. Additionally, water analyses are often incomplete or of insufficient quality. Although SiO
2
(aq), Na, K, and Ca are routinely done with high accuracy and precision, Al and Mg are often pres-
ent at low abundances and are difficult to analyze with high accuracy and precision (Pang and Reed