
Page 109 - Geothermal Energy Renewable Energy and The Environment
P. 109
Exploring for Geothermal Systems 95
GeochemIsTry as an exploraTIon Tool
fluid composiTion and GeoThermomeTry
Geothermal fluids exhibit a broad compositional range, as noted in Chapter 5. However, with the
exception of boron, their compositions completely overlap those of many groundwaters that have
interacted with a broad range of geological environments. Although boron is often elevated in geo-
thermal systems, it alone is insufficient to be an indicator of a potential geothermal prospect. The
concentrations of individual solutes is rarely sufficient to provide good evidence that a potential
geothermal resource is available at depth.
However, as previously discussed in Chapter 5, thermodynamic and kinetic relationships deter-
mine how fluids interact with the rock matrix through which they flow. As a consequence, heated
water contains chemical signatures reflecting rock–water interaction along its flow path. Provided
fluids migrate to the surface at a rate sufficiently high to prevent extensive reequilibration with the
surrounding rocks, a water that has interacted with a geothermal reservoir will possess a record of
that high temperature interaction. It is on the basis of this conceptual model that geothermometers
have been developed. Their use in geothermal exploration is now a common practice.
Consider, for example, a hypothetical geothermal reservoir that is composed of the minerals
α-cristobalite, alkali feldspar, and calcite. Three of the many possible chemical reactions that can
be written for this system are:
SiO (α-cristobalite) < = > SiO (aq)
2
2
NaAlSi O + K < = > KAlSi O + Na +
+
8
8
3
3
−
++
+
CaCO + H < = > Ca + HCO ,
3
3
where SiO (aq) indicates dissolved silica and all of the charged species are part of the solute load.
2
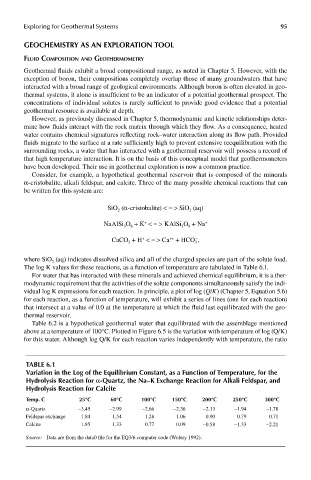
The log K values for these reactions, as a function of temperature are tabulated in Table 6.1.
For water that has interacted with these minerals and achieved chemical equilibrium, it is a ther-
modynamic requirement that the activities of the solute components simultaneously satisfy the indi-
vidual log K expressions for each reaction. In principle, a plot of log (Q/K) (Chapter 5, Equation 5.6)
for each reaction, as a function of temperature, will exhibit a series of lines (one for each reaction)
that intersect at a value of 0.0 at the temperature at which the fluid last equilibrated with the geo-
thermal reservoir.
Table 6.2 is a hypothetical geothermal water that equilibrated with the assemblage mentioned
above at a temperature of 100°C. Plotted in Figure 6.5 is the variation with temperature of log (Q/K)
for this water. Although log Q/K for each reaction varies independently with temperature, the ratio
Table 6.1
Variation in the log of the equilibrium constant, as a Function of Temperature, for the
hydrolysis reaction for α-quartz, the na–k exchange reaction for alkali Feldspar, and
hydrolysis reaction for calcite
Temp. c 25°c 60°c 100°c 150°c 200°c 250°c 300°c
α-Quartz −3.45 −2.99 −2.66 −2.36 −2.13 −1.94 −1.78
Feldspar exchange 1.84 1.54 1.28 1.06 0.90 0.79 0.71
Calcite 1.85 1.33 0.77 0.09 −0.58 −1.33 −2.21
Source: Data are from the data0 file for the EQ3/6 computer code (Wolery 1992).