
Page 112 - Geothermal Energy Renewable Energy and The Environment
P. 112
98 Geothermal Energy: Renewable Energy and the Environment
400
350 Experiment
300
Computed temperature (°C) 250
200
150
100
50
0
0 50 100 150 200 250 300
Measured temperature (°C)
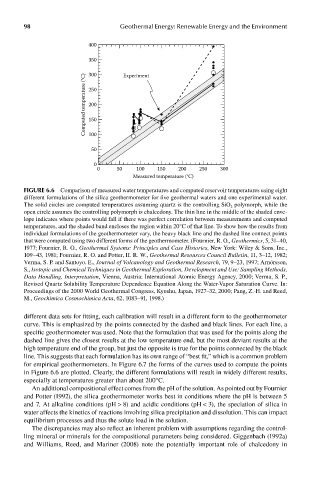
FIGUre 6.6 Comparison of measured water temperatures and computed reservoir temperatures using eight
different formulations of the silica geothermometer for five geothermal waters and one experimental water.
The solid circles are computed temperatures assuming quartz is the controlling SiO 2 polymorph, while the
open circle assumes the controlling polymorph is chalcedony. The thin line in the middle of the shaded enve-
lope indicates where points would fall if there was perfect correlation between measurements and computed
temperatures, and the shaded band encloses the region within 20°C of that line. To show how the results from
individual formulations of the geothermometer vary, the heavy black line and the dashed line connect points
that were computed using two different forms of the geothermometer. (Fournier, R. O., Geothermics, 5, 31–40,
1977; Fournier, R. O., Geothermal Systems: Principles and Case Histories, New York: Wiley & Sons, Inc.,
109–43, 1981; Fournier, R. O. and Potter, II. R. W., Geothermal Resources Council Bulletin, 11, 3–12, 1982;
Verma, S. P. and Santoyo. E., Journal of Volcanology and Geothermal Research, 79, 9–23, 1997; Arnórsson,
S., Isotopic and Chemical Techniques in Geothermal Exploration, Development and Use: Sampling Methods,
Data Handling, Interpretation, Vienna, Austria: International Atomic Energy Agency, 2000; Verma, S. P.,
Revised Quartz Solubility Temperature Dependence Equation Along the Water-Vapor Saturation Curve. In:
Proceedings of the 2000 World Geothermal Congress, Kyushu, Japan, 1927–32, 2000; Pang, Z.-H. and Reed,
M., Geochimica Cosmochimica Acta, 62, 1083–91, 1998.)
different data sets for fitting, each calibration will result in a different form to the geothermometer
curve. This is emphasized by the points connected by the dashed and black lines. For each line, a
specific geothermometer was used. Note that the formulation that was used for the points along the
dashed line gives the closest results at the low temperature end, but the most deviant results at the
high temperature end of the group, but just the opposite is true for the points connected by the black
line. This suggests that each formulation has its own range of “best fit,” which is a common problem
for empirical geothermometers. In Figure 6.7 the forms of the curves used to compute the points
in Figure 6.6 are plotted. Clearly, the different formulations will result in widely different results,
especially at temperatures greater than about 200°C.
An additional compositional effect comes from the pH of the solution. As pointed out by Fournier
and Potter (1992), the silica geothermometer works best in conditions where the pH is between 5
and 7. At alkaline conditions (pH > 8) and acidic conditions (pH < 3), the speciation of silica in
water affects the kinetics of reactions involving silica precipitation and dissolution. This can impact
equilibrium processes and thus the solute load in the solution.
The discrepancies may also reflect an inherent problem with assumptions regarding the control-
ling mineral or minerals for the compositional parameters being considered. Giggenbach (1992a)
and Williams, Reed, and Mariner (2008) note the potentially important role of chalcedony in