
Page 120 - Geothermal Energy Renewable Energy and The Environment
P. 120
106 Geothermal Energy: Renewable Energy and the Environment
500
400
300
Magnetic anomaly (Nano–teslas) 200 0
100
–100
–200
1000
Rhyolite dome
500
Elevation (meters above sea level) –500 0 Buried Nukuhau 2.5 A/m 0.5 A/m 1.7 A/m
1.7 A/m
4.0 A/m
–1000
altered rocks
–1500 volcanic rock Hydrothermally
0 5 10 15
Distance (kilometers)
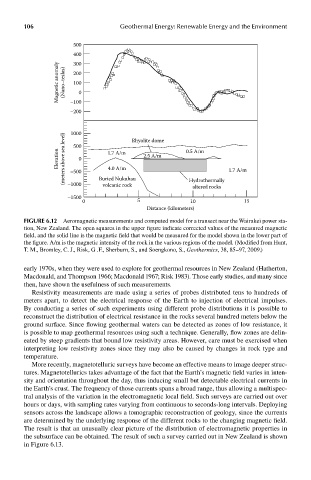
FIGUre 6.12 Aeromagnetic measurements and computed model for a transect near the Wairakei power sta-
tion, New Zealand. The open squares in the upper figure indicate corrected values of the measured magnetic
field, and the solid line is the magnetic field that would be measured for the model shown in the lower part of
the figure. A/m is the magnetic intensity of the rock in the various regions of the model. (Modified from Hunt,
T. M., Bromley, C. J., Risk, G .F., Sherburn, S., and Soengkono, S., Geothermics, 38, 85–97, 2009.)
early 1970s, when they were used to explore for geothermal resources in New Zealand (Hatherton,
Macdonald, and Thompson 1966; Macdonald 1967; Risk 1983). Those early studies, and many since
then, have shown the usefulness of such measurements.
Resistivity measurements are made using a series of probes distributed tens to hundreds of
meters apart, to detect the electrical response of the Earth to injection of electrical impulses.
By conducting a series of such experiments using different probe distributions it is possible to
reconstruct the distribution of electrical resistance in the rocks several hundred meters below the
ground surface. Since flowing geothermal waters can be detected as zones of low resistance, it
is possible to map geothermal resources using such a technique. Generally, flow zones are delin-
eated by steep gradients that bound low resistivity areas. However, care must be exercised when
interpreting low resistivity zones since they may also be caused by changes in rock type and
temperature.
More recently, magnetotelluric surveys have become an effective means to image deeper struc-
tures. Magnetotellurics takes advantage of the fact that the Earth’s magnetic field varies in inten-
sity and orientation throughout the day, thus inducing small but detectable electrical currents in
the Earth’s crust. The frequency of those currents spans a broad range, thus allowing a multispec-
tral analysis of the variation in the electromagnetic local field. Such surveys are carried out over
hours or days, with sampling rates varying from continuous to seconds-long intervals. Deploying
sensors across the landscape allows a tomographic reconstruction of geology, since the currents
are determined by the underlying response of the different rocks to the changing magnetic field.
The result is that an unusually clear picture of the distribution of electromagnetic properties in
the subsurface can be obtained. The result of such a survey carried out in New Zealand is shown
in Figure 6.13.