
Page 164 - Geothermal Energy Renewable Energy and The Environment
P. 164
150 Geothermal Energy: Renewable Energy and the Environment
changed before degradation of the drilling mud could occur. However, beyond a depth of 3642 m
high H S contents in the drilling mud were detected. The H S can be a health hazard and its control
2
2
is of paramount importance to assure the safety of the drilling crew. It appeared that the H S was
2
entering the well from the formation that was being drilled. It was decided to increase the density
(and hence the viscosity) of the mud to try to seal off the well from the formation fluids. However,
the elevated temperatures at the bottom of the well made problematic drilling with higher density
mud. Drilling was terminated at 3729 m.
Downhole surveys were conducted periodically after drilling. It was found that, after six days, the
temperature at the bottom of the hole was 500°C, which is the hottest measured geothermal well.
(a) Lost
34" circulation
26" 0
24" 500
18 5/8" 1,000
17 1/2" 1,500
13 3/8"
12 1/4" Depth (m) 2,000
9 5/8" 2,500
3,000
8 1/2"
7" 3,500
4,000
0 306090 120 150 0 306090 120 150 180
Days since 1/5/94 Days since 1/15/95
WD-1, 1a
(b) 1,000
500
220°C
0
240°C
–500 Shallow aquifer
Elevation (m) –1,000 350°C 260°C
–1,500
–2,000 Young granite
400°C
–2,500 450°C
500°C
–3,000
–3,500
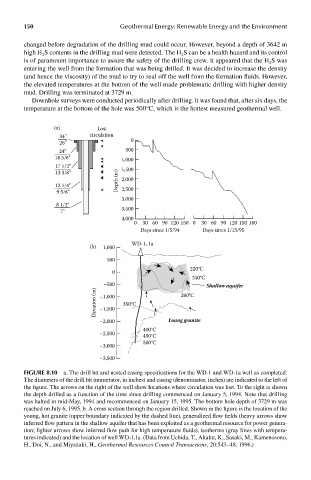
FIGUre 8.10 a. The drill bit and nested casing specifications for the WD-1 and WD-1a well as completed.
The diameters of the drill bit (numerator, in inches) and casing (denominator, inches) are indicated to the left of
the figure. The arrows on the right of the well show locations where circulation was lost. To the right is shown
the depth drilled as a function of the time since drilling commenced on January 5, 1994. Note that drilling
was halted in mid-May, 1994 and recommenced on January 15, 1995. The bottom hole depth of 3729 m was
reached on July 6, 1995. b. A cross section through the region drilled. Shown in the figure is the location of the
young, hot granite (upper boundary indicated by the dashed line), generalized flow fields (heavy arrows show
inferred flow pattern in the shallow aquifer that has been exploited as a geothermal resource for power genera-
tion; lighter arrows show inferred flow path for high temperature fluids), isotherms (gray lines with tempera-
tures indicated) and the location of well WD-1,1a. (Data from Uchida, T., Akaku, K., Sasaki, M., Kamenosono,
H., Doi, N., and Miyazaki, H., Geothermal Resources Council Transactions, 20:543–48, 1996.)