
Page 169 - Geothermal Energy Renewable Energy and The Environment
P. 169
Generating Power Using Geothermal Resources 155
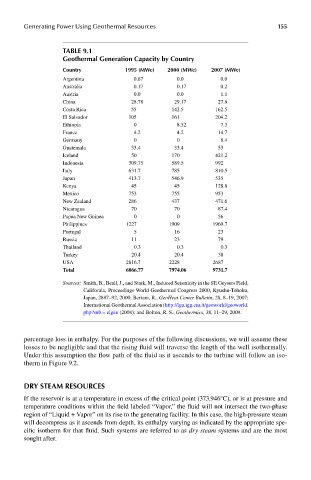
Table 9.1
Geothermal Generation capacity by country
country 1995 (mwe) 2000 (mwe) 2007 (mwe)
Argentina 0.67 0.0 0.0
Australia 0.17 0.17 0.2
Austria 0.0 0.0 1.1
China 28.78 29.17 27.8
Costa Rica 55 142.5 162.5
El Salvador 105 161 204.2
Ethiopia 0 8.52 7.3
France 4.2 4.2 14.7
Germany 0 0 8.4
Guatemala 33.4 33.4 53
Iceland 50 170 421.2
Indonesia 309.75 589.5 992
Italy 631.7 785 810.5
Japan 413.7 546.9 535
Kenya 45 45 128.8
Mexico 753 755 953
New Zealand 286 437 471.6
Nicaragua 70 70 87.4
Papua New Guinea 0 0 56
Philippines 1227 1909 1969.7
Portugal 5 16 23
Russia 11 23 79
Thailand 0.3 0.3 0.3
Turkey 20.4 20.4 38
USA 2816.7 2228 2687
Total 6.8.6.6..7.7. 7.9.7.4..0.6. 9.7.3.1.7.
Sources: Smith, B., Beall, J., and Stark, M., Induced Seismicity in the SE Geysers Field,
California, Proceedings World Geothermal Congress 2000, Kyushu-Tohoku,
Japan, 2887–92, 2000; Bertani, R., GeoHeat Center Bulletin, 28, 8–19, 2007;
International Geothermal Association (http://iga.igg.cnr.it/geoworld/geoworld.
php?sub = elgen (2008); and Bolton, R. S., Geothermics, 38, 11–29, 2009.
percentage loss in enthalpy. For the purposes of the following discussions, we will assume these
losses to be negligible and that the rising fluid will traverse the length of the well isothermally.
Under this assumption the flow path of the fluid as it ascends to the turbine will follow an iso-
therm in Figure 9.2.
dry sTeam resoUrces
If the reservoir is at a temperature in excess of the critical point (373.946°C), or is at pressure and
temperature conditions within the field labeled “Vapor,” the fluid will not intersect the two-phase
region of “Liquid + Vapor” on its rise to the generating facility. In this case, the high-pressure steam
will decompress as it ascends from depth, its enthalpy varying as indicated by the appropriate spe-
cific isotherm for that fluid. Such systems are referred to as dry steam systems and are the most
sought after.