
Page 173 - Geothermal Energy Renewable Energy and The Environment
P. 173
Generating Power Using Geothermal Resources 159
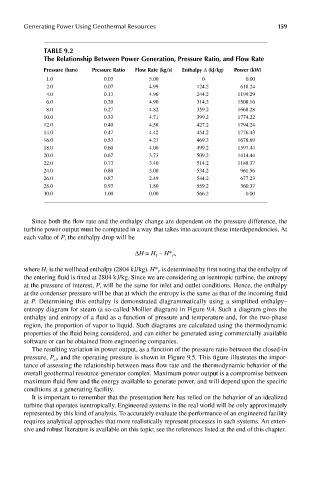
Table 9.2
The relationship between power Generation, pressure ratio, and Flow rate
pressure (bars) pressure ratio Flow rate (kg/s) enthalpy Δ (kJ/kg) power (kw)
1.0 0.03 5.00 0 0.00
2.0 0.07 4.99 124.2 618.24
4.0 0.13 4.96 244.2 1199.29
6.0 0.20 4.90 314.2 1508.16
8.0 0.27 4.82 359.2 1668.28
10.0 0.33 4.71 399.2 1774.22
12.0 0.40 4.58 427.2 1794.24
14.0 0.47 4.42 454.2 1776.43
16.0 0.53 4.23 469.2 1678.69
18.0 0.60 4.00 499.2 1597.44
20.0 0.67 3.73 509.2 1414.44
22.0 0.73 3.40 514.2 1188.37
24.0 0.80 3.00 534.2 961.56
26.0 0.87 2.49 544.2 677.23
28.0 0.93 1.80 559.2 360.37
30.0 1.00 0.00 566.2 0.00
Since both the flow rate and the enthalpy change are dependent on the pressure difference, the
turbine power output must be computed in a way that takes into account these interdependencies. At
each value of P, the enthalpy drop will be
Δ H = H – H* ,
1
P
where H is the wellhead enthalpy (2804 kJ/kg). H* is determined by first noting that the enthalpy of
P
1
the entering fluid is fixed at 2804 kJ/kg. Since we are considering an isentropic turbine, the entropy
at the pressure of interest, P, will be the same for inlet and outlet conditions. Hence, the enthalpy
at the condenser pressure will be that at which the entropy is the same as that of the incoming fluid
at P. Determining this enthalpy is demonstrated diagrammatically using a simplified enthalpy–
entropy diagram for steam (a so-called Mollier diagram) in Figure 9.4. Such a diagram gives the
enthalpy and entropy of a fluid as a function of pressure and temperature and, for the two-phase
region, the proportion of vapor to liquid. Such diagrams are calculated using the thermodynamic
properties of the fluid being considered, and can either be generated using commercially available
software or can be obtained from engineering companies.
The resulting variation in power output, as a function of the pressure ratio between the closed-in
pressure, P , and the operating pressure is shown in Figure 9.5. This figure illustrates the impor-
cl
tance of assessing the relationship between mass flow rate and the thermodynamic behavior of the
overall geothermal resource-generator complex. Maximum power output is a compromise between
maximum fluid flow and the energy available to generate power, and will depend upon the specific
conditions at a generating facility.
It is important to remember that the presentation here has relied on the behavior of an idealized
turbine that operates isentropically. Engineered systems in the real world will be only approximately
represented by this kind of analysis. To accurately evaluate the performance of an engineered facility
requires analytical approaches that more realistically represent processes in such systems. An exten-
sive and robust literature is available on this topic; see the references listed at the end of this chapter.