
Page 176 - Geothermal Energy Renewable Energy and The Environment
P. 176
162 Geothermal Energy: Renewable Energy and the Environment
10,000.0
0°C
1000.0 350°C
1 400°C
100.0 300°C
Liquid 250°C
Pressure (bars) 10.0 150°C
200°C
1.0 100°C Vapor
20% 40% 60%
0.1 3 50°C 2 2 *
Liquid + Vapor 80%
25°C
0.01
0 500 1000 1500 2000 2500 3000 3500
Enthalpy (kJ/kg)
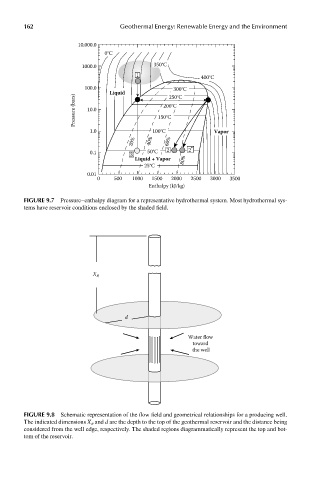
FIGUre 9.7 Pressure–enthalpy diagram for a representative hydrothermal system. Most hydrothermal sys-
tems have reservoir conditions enclosed by the shaded field.
X R
d
Water flow
toward
the well
FIGUre 9.8 Schematic representation of the flow field and geometrical relationships for a producing well.
The indicated dimensions X R and d are the depth to the top of the geothermal reservoir and the distance being
considered from the well edge, respectively. The shaded regions diagrammatically represent the top and bot-
tom of the reservoir.