
Page 174 - Geothermal Energy Renewable Energy and The Environment
P. 174
160 Geothermal Energy: Renewable Energy and the Environment
Temp. (C)
4000 10.0 5.0 2.0 1.0
20.0 700
3800 0.5
600
3600 0.2
500
3400 0.1
400
3200 350
Enthalpy (kJ/kg) 3000 250
300
200
2800
150
2600 0.05 100
50
0.01 0.001
2400
0.95
2200 0.90
0.85
2000 0.80
0.75
1800
0.70
6.0 7.0 8.0 9.0
Entropy (kJ/k-K)
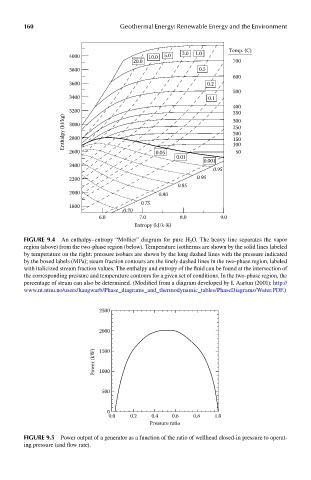
FIGUre 9.4 An enthalpy–entropy “Mollier” diagram for pure H 2 O. The heavy line separates the vapor
region (above) from the two-phase region (below). Temperature isotherms are shown by the solid lines labeled
by temperature on the right; pressure isobars are shown by the long dashed lines with the pressure indicated
by the boxed labels (MPa); steam fraction contours are the finely dashed lines in the two-phase region, labeled
with italicized stream fraction values. The enthalpy and entropy of the fluid can be found at the intersection of
the corresponding pressure and temperature contours for a given set of conditions. In the two-phase region, the
percentage of steam can also be determined. (Modified from a diagram developed by I. Aartun (2001): http://
www.nt.ntnu.no/users/haugwarb/Phase_diagrams_and_thermodynamic_tables/PhaseDiagrams/Water.PDF.)
2500
2000
Power (kW) 1500
1000
500
0
0.0 0.2 0.4 0.6 0.8 1.0
Pressure ratio
FIGUre 9.5 Power output of a generator as a function of the ratio of wellhead closed-in pressure to operat-
ing pressure (and flow rate).