
Page 39 - Geothermal Energy Renewable Energy and The Environment
P. 39
22 Geothermal Energy: Renewable Energy and the Environment
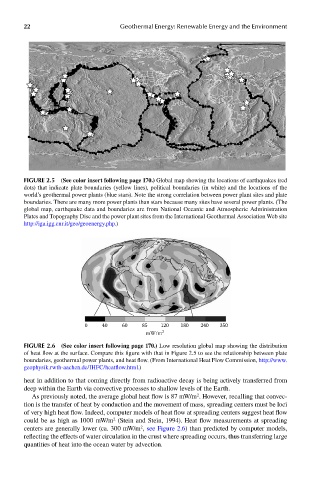
FIGUre 2.5 (See color insert following page 17.0..) Global map showing the locations of earthquakes (red
dots) that indicate plate boundaries (yellow lines), political boundaries (in white) and the locations of the
world’s geothermal power plants (blue stars). Note the strong correlation between power plant sites and plate
boundaries. There are many more power plants than stars because many sites have several power plants. (The
global map, earthquake data and boundaries are from National Oceanic and Atmospheric Administration
Plates and Topography Disc and the power plant sites from the International Geothermal Association Web site
http://iga.igg.cnr.it/geo/geoenergy.php.)
0 40 60 85 120 180 240 350
mW/m 2
FIGUre 2.6 (See color insert following page 17.0..) Low resolution global map showing the distribution
of heat flow at the surface. Compare this figure with that in Figure 2.5 to see the relationship between plate
boundaries, geothermal power plants, and heat flow. (From International Heat Flow Commission, http://www.
geophysik.rwth-aachen.de/IHFC/heatflow.html.)
heat in addition to that coming directly from radioactive decay is being actively transferred from
deep within the Earth via convective processes to shallow levels of the Earth.
2
As previously noted, the average global heat flow is 87 mW/m . However, recalling that convec-
tion is the transfer of heat by conduction and the movement of mass, spreading centers must be loci
of very high heat flow. Indeed, computer models of heat flow at spreading centers suggest heat flow
2
could be as high as 1000 mW/m (Stein and Stein, 1994). Heat flow measurements at spreading
2
centers are generally lower (ca. 300 mW/m , see Figure 2.6) than predicted by computer models,
reflecting the effects of water circulation in the crust where spreading occurs, thus transferring large
quantities of heat into the ocean water by advection.