
Page 58 - Geothermal Energy Renewable Energy and The Environment
P. 58
Thermodynamics and Geothermal Systems 41
0.70
0.60 40°C 20°C
Thermodynamic efficiency (e) 0.40
0.50
0.30
0.20 65°C
0.10
50 100 150 200 250 300 350 400 450
Temperature (°C)
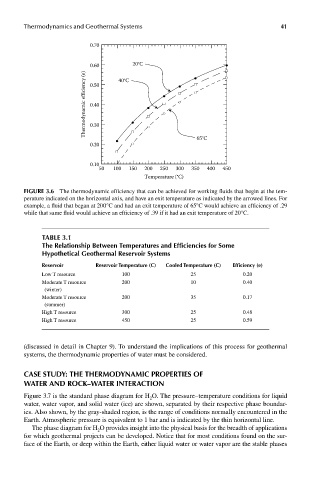
FIGUre 3.6 The thermodynamic efficiency that can be achieved for working fluids that begin at the tem-
perature indicated on the horizontal axis, and have an exit temperature as indicated by the arrowed lines. For
example, a fluid that began at 200°C and had an exit temperature of 65°C would achieve an efficiency of .29
while that same fluid would achieve an efficiency of .39 if it had an exit temperature of 20°C.
Table 3.1
The relationship between Temperatures and efficiencies for some
hypothetical Geothermal reservoir systems
reservoir reservoir Temperature (c) cooled Temperature (c) efficiency (e)
Low T resource 100 25 0.20
Moderate T resource 200 10 0.40
(winter)
Moderate T resource 200 35 0.17
(summer)
High T resource 300 25 0.48
High T resource 450 25 0.59
(discussed in detail in Chapter 9). To understand the implications of this process for geothermal
systems, the thermodynamic properties of water must be considered.
case sTUdy: The ThermodynamIc properTIes oF
waTer and rock–waTer InTeracTIon
Figure 3.7 is the standard phase diagram for H O. The pressure–temperature conditions for liquid
2
water, water vapor, and solid water (ice) are shown, separated by their respective phase boundar-
ies. Also shown, by the gray-shaded region, is the range of conditions normally encountered in the
Earth. Atmospheric pressure is equivalent to 1 bar and is indicated by the thin horizontal line.
The phase diagram for H O provides insight into the physical basis for the breadth of applications
2
for which geothermal projects can be developed. Notice that for most conditions found on the sur-
face of the Earth, or deep within the Earth, either liquid water or water vapor are the stable phases