
Page 59 - Geothermal Energy Renewable Energy and The Environment
P. 59
42 Geothermal Energy: Renewable Energy and the Environment
T (°C)
–73 27 127 227 327 427 527
10 4 10 5
Meters
Liquid
Subsurface conditions
10 3 10 4 ~30,000
10 2 10 3 ~3000
10 1 Critical point 10 2 ~300
10 0 10 1 Bars ~30
MPa Power
10 –1 10 0 0
10 –2 GSHP DU 10 –1
Vapor
10 –3 Triple point 10 –2
10 –4 10 –3
Solid
10 –5 –4
10
200 300 400 500 600 700 800
T (°K)
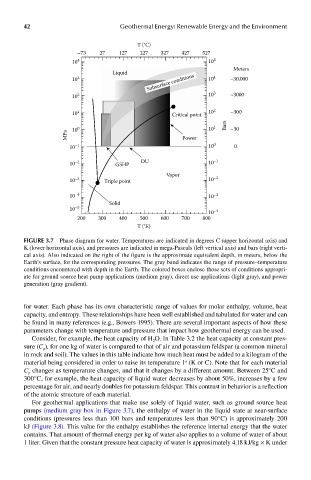
FIGUre 3.7 Phase diagram for water. Temperatures are indicated in degrees C (upper horizontal axis) and
K (lower horizontal axis), and pressures are indicated in mega-Pascals (left vertical axis) and bars (right verti-
cal axis). Also indicated on the right of the figure is the approximate equivalent depth, in meters, below the
Earth’s surface, for the corresponding pressures. The gray band indicates the range of pressure–temperature
conditions encountered with depth in the Earth. The colored boxes enclose those sets of conditions appropri-
ate for ground source heat pump applications (medium gray), direct use applications (light gray), and power
generation (gray gradient).
for water. Each phase has its own characteristic range of values for molar enthalpy, volume, heat
capacity, and entropy. These relationships have been well established and tabulated for water and can
be found in many references (e.g., Bowers 1995). There are several important aspects of how these
parameters change with temperature and pressure that impact how geothermal energy can be used.
Consider, for example, the heat capacity of H O. In Table 3.2 the heat capacity at constant pres-
2
sure (C ), for one kg of water is compared to that of air and potassium feldspar (a common mineral
p
in rock and soil). The values in this table indicate how much heat must be added to a kilogram of the
material being considered in order to raise its temperature 1 (K or C). Note that for each material
o
C changes as temperature changes, and that it changes by a different amount. Between 25°C and
p
300°C, for example, the heat capacity of liquid water decreases by about 50%, increases by a few
percentage for air, and nearly doubles for potassium feldspar. This contrast in behavior is a reflection
of the atomic structure of each material.
For geothermal applications that make use solely of liquid water, such as ground source heat
pumps (medium gray box in Figure 3.7), the enthalpy of water in the liquid state at near-surface
conditions (pressures less than 100 bars and temperatures less than 90°C) is approximately 200
kJ (Figure 3.8). This value for the enthalpy establishes the reference internal energy that the water
contains. That amount of thermal energy per kg of water also applies to a volume of water of about
1 liter. Given that the constant pressure heat capacity of water is approximately 4.18 kJ/kg × K under