
Page 68 - Geothermal Energy Renewable Energy and The Environment
P. 68
52 Geothermal Energy: Renewable Energy and the Environment
Recharge
Recharge
Heat source
FIGUre 4.1 Diagrammatic representation of the processes and fluid flow paths that influence the availability
of fluids for geothermal purposes. The unornamented regions represent bedrock highs that have little perme-
ability and thus allow only minor infiltration. Surface flow (gray arrows) over these zones descends along
bounding regions into the basin where various sedimentary rock units with differing porosity and permeability
allow infiltration and subsurface flow (black arrows). Buried hydraulic barriers divert the flow toward the center
of the basin. In the subsurface, a cooling igneous body acts as a heat source for providing geothermal energy.
0.50
–5
4.5 × 10 cm 5.9 × 10 –3 cm 1.0 × 10 –2 cm
0.40
0.30
PDF
0.20
0.10
0.0
–15.0 –10.0 –5.0 0.0
In (r)
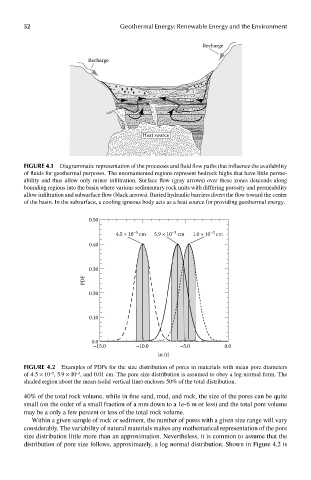
FIGUre 4.2 Examples of PDFs for the size distribution of pores in materials with mean pore diameters
of 4.5 × 10 , 5.9 × 10 , and 0.01 cm. The pore size distribution is assumed to obey a log-normal form. The
−5
−3
shaded region about the mean (solid vertical line) encloses 50% of the total distribution.
40% of the total rock volume, while in fine sand, mud, and rock, the size of the pores can be quite
small (on the order of a small fraction of a mm down to a 1e-6 m or less) and the total pore volume
may be a only a few percent or less of the total rock volume.
Within a given sample of rock or sediment, the number of pores with a given size range will vary
considerably. The variability of natural materials makes any mathematical representation of the pore
size distribution little more than an approximation. Nevertheless, it is common to assume that the
distribution of pore size follows, approximately, a log normal distribution. Shown in Figure 4.2 is