
Page 69 - Geothermal Energy Renewable Energy and The Environment
P. 69
Subsurface Fluid Flow: The Hydrology of Geothermal Systems 53
the log normal probability density function (PDF) for three different samples with mean pore sizes
−5
−3
of 4.5 × 10 cm, 5.9 × 10 cm, and 0.01 cm. A PDF is simply a description of what the probability is
of finding a parameter of a certain value where the sum of all probabilities is 1.0, and the distribution
follows some defined mathematical function (in this case, a log normal form; Kosugi and Hopmans
1998). Also shown in the figure is the mean value, and the region around the mean that accounts for
50% of the total pore size distribution.
Natural systems will not exactly follow any mathematical description of the pore size distribu-
tion because very few geological materials are sufficiently homogeneous to accommodate such
regularity. Nevertheless, mathematical descriptions are useful because they provide a quantitative
approximation that allows modeling of the behavior exhibited by natural systems. Such models
allow flow rates to be calculated, thus allowing evaluation of the suitability of a rock material for
development of geothermal applications.
The fraction of the pore space that is actually water-filled also varies considerably, depending
primarily upon climate, elevation, and the ability of the soil or rock to drain water. The extent to
which pores are filled is called the saturation. In regions with high rainfall and low elevation, fully
saturated conditions (saturation = 100%) are usually encountered within a few meters to a few tens
of meters below the ground surface. The static water table is that point below which the rock is
fully saturated.
Between the water table and the ground surface, the soil or rock is within the unsaturated zone
or vadose zone. Within the unsaturated zone, the rock will not be dry, in the sense that water is com-
pletely absent from the pores, even though a sample of material from the unsaturated zone may appear
to be absolutely dry. Water will be retained at points of contact between grains, and within small
pores due to the surface tension of water. The extent to which this surface tension-pore geometry
relationship affects the ability of rock to retain water is called capillary suction or capillary suction
potential. The only conditions under which rock is completely free of liquid water in the subsurface
are when the ambient temperatures are elevated significantly above the boiling point of water.
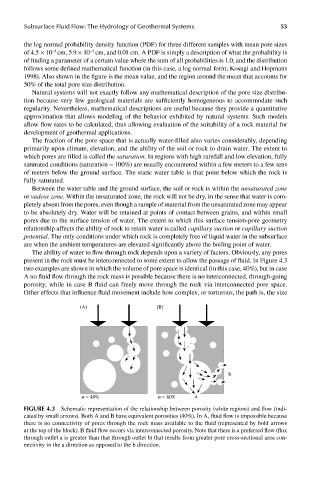
The ability of water to flow through rock depends upon a variety of factors. Obviously, any pores
present in the rock must be interconnected to some extent to allow the passage of fluid. In Figure 4.3
two examples are shown in which the volume of pore space is identical (in this case, 40%), but in case
A no fluid flow through the rock mass is possible because there is no interconnected, through-going
porosity, while in case B fluid can freely move through the rock via interconnected pore space.
Other effects that influence fluid movement include how complex, or torturous, the path is, the size
(A) (B)
b
ø = 40% ø = 40% a
FIGUre 4.3 Schematic representation of the relationship between porosity (white regions) and flow (indi-
cated by small arrows). Both A and B have equivalent porosities (40%). In A, fluid flow is impossible because
there is no connectivity of pores through the rock mass available to the fluid (represented by bold arrows
at the top of the block). B fluid flow occurs via interconnected porosity. Note that there is a preferred flow (flux
through outlet a is greater than that through outlet b) that results from greater pore cross-sectional area con-
nectivity in the a direction as opposed to the b direction.