
Page 79 - Geothermal Energy Renewable Energy and The Environment
P. 79
Subsurface Fluid Flow: The Hydrology of Geothermal Systems 63
volcanic ash fell back into the caldera, forming a thick layer of rock known as the Bishop Tuff that
only partially filled the huge depression.
Within 100,000 years after this major eruption, the central part of the caldera rose to form a
“resurgent” dome, apparently in response to pressure from rising magma some kilometers at depth.
The caldera thus took on the form of a large depression with a central highland. The deep ring sur-
rounding the resurgent dome slowly began to accumulate the eruption products of later, smaller
volcanic events. The volcanic activity within this “moat” has continued to the present day, the
most recent activity being the movement of magma in the subsurface that caused extensive seismic
activity (Hill et al. 1990) and release of CO (Sorey et al. 1993) that killed thousands of trees in
2
1989–1990 (Farrar et al. 1995).
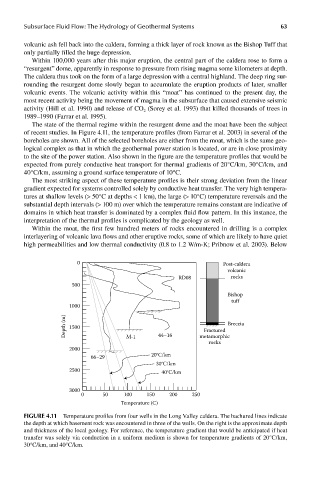
The state of the thermal regime within the resurgent dome and the moat have been the subject
of recent studies. In Figure 4.11, the temperature profiles (from Farrar et al. 2003) in several of the
boreholes are shown. All of the selected boreholes are either from the moat, which is the same geo-
logical complex as that in which the geothermal power station is located, or are in close proximity
to the site of the power station. Also shown in the figure are the temperature profiles that would be
expected from purely conductive heat transport for thermal gradients of 20°C/km, 30°C/km, and
40°C/km, assuming a ground surface temperature of 10°C.
The most striking aspect of these temperature profiles is their strong deviation from the linear
gradient expected for systems controlled solely by conductive heat transfer. The very high tempera-
tures at shallow levels (> 50°C at depths < 1 km), the large (> 10°C) temperature reversals and the
substantial depth intervals (> 100 m) over which the temperature remains constant are indicative of
domains in which heat transfer is dominated by a complex fluid flow pattern. In this instance, the
interpretation of the thermal profiles is complicated by the geology as well.
Within the moat, the first few hundred meters of rocks encountered in drilling is a complex
interlayering of volcanic lava flows and other eruptive rocks, some of which are likely to have quiet
high permeabilities and low thermal conductivity (0.8 to 1.2 W/m-K; Pribnow et al. 2003). Below
0 Post-caldera
volcanic
RD08 rocks
500
Bishop
tuff
1000
Depth (m) 1500 Fractured Breccia
44–16
metamorphic
M-1
rocks
2000
66–29 20°C/km
30°C/km
2500 40°C/km
3000
0 50 100 150 200 250
Temperature (C)
FIGUre 4.11 Temperature profiles from four wells in the Long Valley caldera. The hachured lines indicate
the depth at which basement rock was encountered in three of the wells. On the right is the approximate depth
and thickness of the local geology. For reference, the temperature gradient that would be anticipated if heat
transfer was solely via conduction in a uniform medium is shown for temperature gradients of 20°C/km,
30°C/km, and 40°C/km.