
Page 80 - Geothermal Energy Renewable Energy and The Environment
P. 80
64 Geothermal Energy: Renewable Energy and the Environment
this series of rocks is the Bishop Tuff. The Bishop Tuff has a lower section that is unwelded and
relatively unconsolidated, and a middle, densely welded section. Recent faulting has caused the
development of high permeability fracture zones that are vertically oriented. This has resulted in an
anisotropic permeability distribution that favors vertical fracture flow (Evans and Bradbury 2004).
The Bishop Tuff is deposited on a sequence of earlier breccias and other volcanic rocks that overly
the crystalline, very low porosity metamorphic basement rocks. The latter have relatively high ther-
mal conductivities (3.0–3.8 W/m-K; Pribnow et al. 2003).
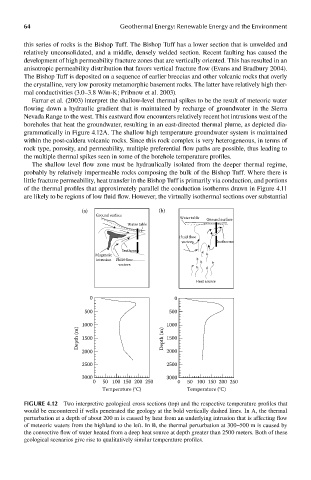
Farrar et al. (2003) interpret the shallow-level thermal spikes to be the result of meteoric water
flowing down a hydraulic gradient that is maintained by recharge of groundwater in the Sierra
Nevada Range to the west. This eastward flow encounters relatively recent hot intrusions west of the
boreholes that heat the groundwater, resulting in an east-directed thermal plume, as depicted dia-
grammatically in Figure 4.12A. The shallow high temperature groundwater system is maintained
within the post-caldera volcanic rocks. Since this rock complex is very heterogeneous, in terms of
rock type, porosity, and permeability, multiple preferential flow paths are possible, thus leading to
the multiple thermal spikes seen in some of the borehole temperature profiles.
The shallow level flow zone must be hydraulically isolated from the deeper thermal regime,
probably by relatively impermeable rocks composing the bulk of the Bishop Tuff. Where there is
little fracture permeability, heat transfer in the Bishop Tuff is primarily via conduction, and portions
of the thermal profiles that approximately parallel the conduction isotherms drawn in Figure 4.11
are likely to be regions of low fluid flow. However, the virtually isothermal sections over substantial
(a) (b)
Ground surface
Water table Ground surface
Water table
Fluid flow
vectors Isotherms
Isotherms
Magmatic
intrusion Fluid flow
vectors
Heat source
0 0
500 500
Depth (m) 1000 Depth (m) 1000
1500
1500
2000 2000
2500 2500
3000 3000
0 50 100 150 200 250 0 50 100 150 200 250
Temperature (°C) Temperature (°C)
FIGUre 4.12 Two interpretive geological cross sections (top) and the respective temperature profiles that
would be encountered if wells penetrated the geology at the bold vertically dashed lines. In A, the thermal
perturbation at a depth of about 200 m is caused by heat from an underlying intrusion that is affecting flow
of meteoric waters from the highland to the left. In B, the thermal perturbation at 300–500 m is caused by
the convective flow of water heated from a deep heat source at depth greater than 2500 meters. Both of these
geological scenarios give rise to qualitatively similar temperature profiles.