
Page 406 - Global Project Management Handbook
P. 406
PROJECT PORTFOLIO SCORE CARD 19-15
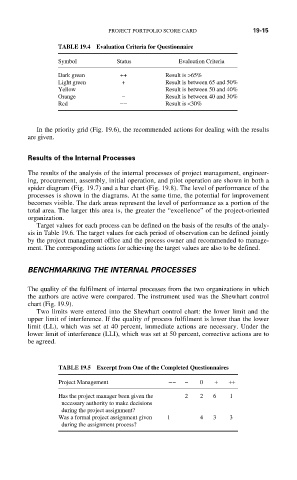
TABLE 19.4 Evaluation Criteria for Questionnaire
Symbol Status Evaluation Criteria
Dark green ++ Result is >65%
Light green + Result is between 65 and 50%
Yellow Result is between 50 and 40%
Orange − Result is between 40 and 30%
Red −− Result is <30%
In the priority grid (Fig. 19.6), the recommended actions for dealing with the results
are given.
Results of the Internal Processes
The results of the analysis of the internal processes of project management, engineer-
ing, procurement, assembly, initial operation, and pilot operation are shown in both a
spider diagram (Fig. 19.7) and a bar chart (Fig. 19.8). The level of performance of the
processes is shown in the diagrams. At the same time, the potential for improvement
becomes visible. The dark areas represent the level of performance as a portion of the
total area. The larger this area is, the greater the “excellence” of the project-oriented
organization.
Target values for each process can be defined on the basis of the results of the analy-
sis in Table 19.6. The target values for each period of observation can be defined jointly
by the project management office and the process owner and recommended to manage-
ment. The corresponding actions for achieving the target values are also to be defined.
BENCHMARKING THE INTERNAL PROCESSES
The quality of the fulfilment of internal processes from the two organizations in which
the authors are active were compared. The instrument used was the Shewhart control
chart (Fig. 19.9).
Two limits were entered into the Shewhart control chart: the lower limit and the
upper limit of interference. If the quality of process fulfilment is lower than the lower
limit (LL), which was set at 40 percent, immediate actions are necessary. Under the
lower limit of interference (LLI), which was set at 50 percent, corrective actions are to
be agreed.
TABLE 19.5 Excerpt from One of the Completed Questionnaires
Project Management −− − 0 + ++
Has the project manager been given the 2 2 6 1
necessary authority to make decisions
during the project assignment?
Was a formal project assignment given 1 4 3 3
during the assignment process?