
Page 192 - Glucose Monitoring Devices
P. 192
194 CHAPTER 9 Calibration of CGM systems
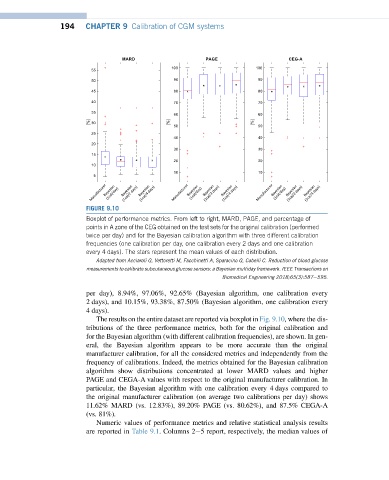
FIGURE 9.10
Boxplot of performance metrics. From left to right, MARD, PAGE, and percentage of
points in A zone of the CEG obtained on the test sets for the original calibration (performed
twice per day) and for the Bayesian calibration algorithm with three different calibration
frequencies (one calibration per day, one calibration every 2 days and one calibration
every 4 days). The stars represent the mean values of each distribution.
Adapted from Acciaroli G, Vettoretti M, Facchinetti A, Sparacino G, Cobelli C. Reduction of blood glucose
measurements to calibrate subcutaneous glucose sensors: a Bayesian multiday framework. IEEE Transactions on
Biomedical Engineering 2018;65(3):587e595.
per day), 8.94%, 97.06%, 92.65% (Bayesian algorithm, one calibration every
2 days), and 10.15%, 93.38%, 87.50% (Bayesian algorithm, one calibration every
4 days).
The results on the entire dataset are reported via boxplot in Fig. 9.10, where the dis-
tributions of the three performance metrics, both for the original calibration and
for the Bayesian algorithm (with different calibration frequencies), are shown. In gen-
eral, the Bayesian algorithm appears to be more accurate than the original
manufacturer calibration, for all the considered metrics and independently from the
frequency of calibrations. Indeed, the metrics obtained for the Bayesian calibration
algorithm show distributions concentrated at lower MARD values and higher
PAGE and CEGA-A values with respect to the original manufacturer calibration. In
particular, the Bayesian algorithm with one calibration every 4 days compared to
the original manufacturer calibration (on average two calibrations per day) shows
11.62% MARD (vs. 12.83%), 89.20% PAGE (vs. 80.62%), and 87.5% CEGA-A
(vs. 81%).
Numeric values of performance metrics and relative statistical analysis results
are reported in Table 9.1. Columns 2e5 report, respectively, the median values of