
Page 195 - Glucose Monitoring Devices
P. 195
Conclusions 197
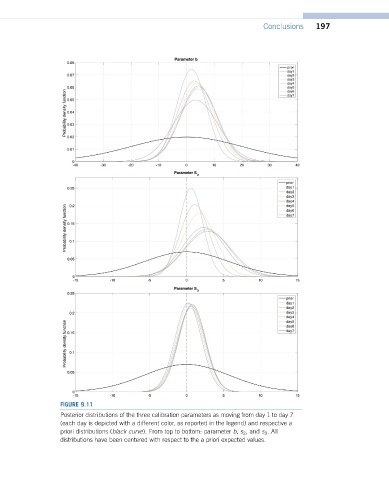
FIGURE 9.11
Posterior distributions of the three calibration parameters as moving from day 1 to day 7
(each day is depicted with a different color, as reported in the legend) and respective a
priori distributions (black curve). From top to bottom: parameter b, s 2 , and s 3 . All
distributions have been centered with respect to the a priori expected values.