
Page 207 - Glucose Monitoring Devices
P. 207
210 CHAPTER 10 CGM filtering and denoising techniques
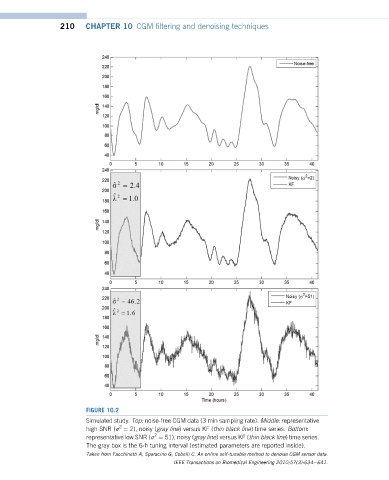
FIGURE 10.2
Simulated study. Top: noise-free CGM data (3 min sampling rate). Middle: representative
2
high SNR (s ¼ 2), noisy (gray line) versus KF (thin black line) time series. Bottom:
2
representative low SNR (s ¼ 51), noisy (gray line) versus KF (thin black line) time series.
The gray box is the 6-h tuning interval (estimated parameters are reported inside).
Taken from Facchinetti A, Sparacino G, Cobelli C. An online self-tunable method to denoise CGM sensor data.
IEEE Transactions on Biomedical Engineering 2010;57(3):634e641.