
Page 208 - Glucose Monitoring Devices
P. 208
CGM denoising by Kalman filter 211
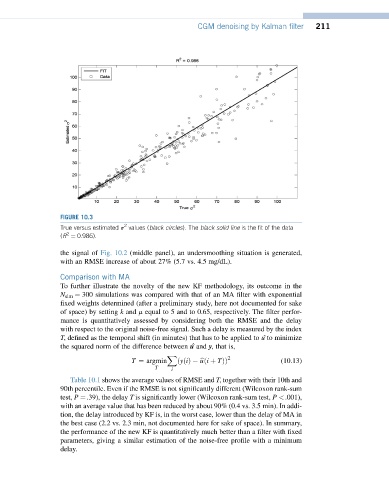
FIGURE 10.3
2
True versus estimated s values (black circles). The black solid line is the fit of the data
2
(R ¼ 0.986).
the signal of Fig. 10.2 (middle panel), an undersmoothing situation is generated,
with an RMSE increase of about 27% (5.7 vs. 4.5 mg/dL).
Comparison with MA
To further illustrate the novelty of the new KF methodology, its outcome in the
N sim ¼ 300 simulations was compared with that of an MA filter with exponential
fixed weights determined (after a preliminary study, here not documented for sake
of space) by setting k and m equal to 5 and to 0.65, respectively. The filter perfor-
mance is quantitatively assessed by considering both the RMSE and the delay
with respect to the original noise-free signal. Such a delay is measured by the index
T, defined as the temporal shift (in minutes) that has to be applied to u ˆ to minimize
the squared norm of the difference between u ˆ and y, that is,
X 2
T ¼ argmin ðyðiÞ b uði þ TÞÞ (10.13)
T
i
Table 10.1 shows the average values of RMSE and T, together with their 10th and
90th percentile. Even if the RMSE is not significantly different (Wilcoxon rank-sum
test, P ¼.39), the delay T is significantly lower (Wilcoxon rank-sum test, P <.001),
with an average value that has been reduced by about 90% (0.4 vs. 3.5 min). In addi-
tion, the delay introduced by KF is, in the worst case, lower than the delay of MA in
the best case (2.2 vs. 2.3 min, not documented here for sake of space). In summary,
the performance of the new KF is quantitatively much better than a filter with fixed
parameters, giving a similar estimation of the noise-free profile with a minimum
delay.