
Page 209 - Glucose Monitoring Devices
P. 209
212 CHAPTER 10 CGM filtering and denoising techniques
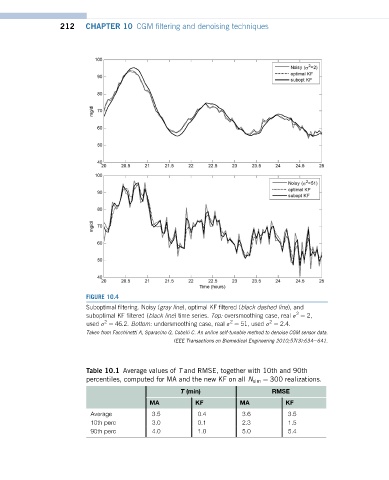
FIGURE 10.4
Suboptimal filtering. Noisy (gray line), optimal KF filtered (black dashed line), and
2
suboptimal KF filtered (black line) time series. Top: oversmoothing case, real s ¼ 2,
2
2
2
used s ¼ 46.2. Bottom: undersmoothing case, real s ¼ 51, used s ¼ 2.4.
Taken from Facchinetti A, Sparacino G, Cobelli C. An online self-tunable method to denoise CGM sensor data.
IEEE Transactions on Biomedical Engineering 2010;57(3):634e641.
Table 10.1 Average values of T and RMSE, together with 10th and 90th
percentiles, computed for MA and the new KF on all N sim ¼ 300 realizations.
T (min) RMSE
MA KF MA KF
Average 3.5 0.4 3.6 3.5
10th perc 3.0 0.1 2.3 1.5
90th perc 4.0 1.0 5.0 5.4