
Page 211 - Glucose Monitoring Devices
P. 211
214 CHAPTER 10 CGM filtering and denoising techniques
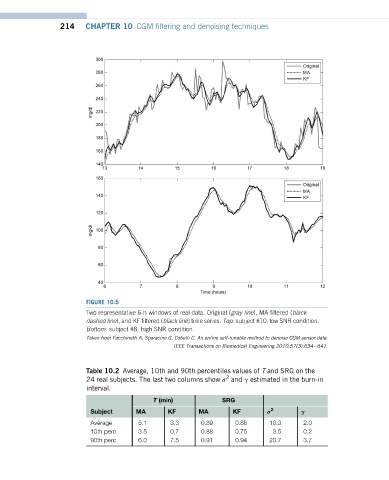
FIGURE 10.5
Two representative 6-h windows of real data. Original (gray line), MA filtered (black
dashed line), and KF filtered (black line) time series. Top: subject #10, low SNR condition.
Bottom: subject #8, high SNR condition.
Taken from Facchinetti A, Sparacino G, Cobelli C. An online self-tunable method to denoise CGM sensor data.
IEEE Transactions on Biomedical Engineering 2010;57(3):634e641.
Table 10.2 Average, 10th and 90th percentiles values of T and SRG on the
2
24 real subjects. The last two columns show s and g estimated in the burn-in
interval.
T (min) SRG
Subject MA KF MA KF s 2 g
Average 5.1 3.3 0.89 0.86 10.3 2.0
10th perc 3.5 0.7 0.88 0.75 3.5 0.2
90th perc 6.0 7.5 0.91 0.94 20.7 3.7