
Page 212 - Glucose Monitoring Devices
P. 212
CGM denoising by Kalman filter 215
SNR, is able to tune the proper smoothing in different SNR conditions, and therefore
it is an effective solution to problem of the SNR variability from individual to
2
individual. As far as the estimation of s is concerned, it clearly appears from the
2
2
10th and 90th percentile values (3.5 and 20.7 mg /dL ) that the measurement noise
variance is very different from an individual to another, numerically resembling
what has been observed by graphical inspection. Furthermore, as far as the regula-
rization parameter g is concerned, which we remind to be the so-called Q/R ratio,
and which is estimated in the 6 h tuning interval, these values result very different
between individuals. The fact is not surprising, resembling the observation on the
need for filter parameters individualization made previously, in which more than
one order of growth rate was detected. Quantitatively, on the real dataset, the
difference between the maximum (11.45) to minimum (0.04) values is about three
orders of growth rate. This confirms also on real data the necessity of parameter
individualization to avoid suboptimal filtering.
Dealing with SNR intraindividual variability
In the presence of intraindividual variability of the SNR, the KF approach for denois-
ing CGM data presented so far performed will result in suboptimal, with a portion of
the signal that may result under- or oversmoothed. The existence of the intraindivid-
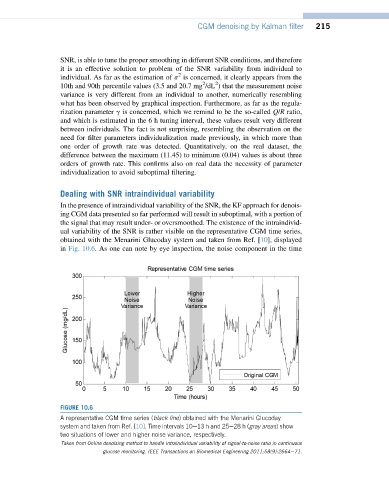
ual variability of the SNR is rather visible on the representative CGM time series,
obtained with the Menarini Glucoday system and taken from Ref. [10], displayed
in Fig. 10.6. As one can note by eye inspection, the noise component in the time
FIGURE 10.6
A representative CGM time series (black line) obtained with the Menarini Glucoday
system and taken from Ref. [10]. Time intervals 10e13 h and 25e28 h (gray areas) show
two situations of lower and higher noise variance, respectively.
Taken from Online denoising method to handle intraindividual variability of signal-to-noise ratio in continuous
glucose monitoring. IEEE Transactions on Biomedical Engineering 2011;58(9):2664e71.