
Page 217 - Glucose Monitoring Devices
P. 217
220 CHAPTER 11 Retrofitting CGM traces
studies testing we conducted in 2012e14 [11e14], offering a relatively large
number of highly accurate references (YSI) to retrospectively the CGM.
Then, in section Retrofitting real-life adjunctive data, we show that the retrofit-
ting method is capable also to improve the accuracy of a newer and more accurate
Dexcom sensor (Dexcom G5) that reached the 1-digit precision (currently one of the
most accurate CGMs on the market) with data collected in real-life conditions.
Finally, in section Accuracy of retrofitted CGM versus number of references
available, we investigate how the accuracy improvement granted by the retrofitting
method is affected by the number of BG measurement available.
The retrofitting algorithm
Problem formulation
The retrofitting method reconstructs, with high temporal resolution, BG concentra-
tion profile, bgðtÞ from CGM records, cgmðtÞ, i.e., measurements of the interstitial
glucose concentration affected by noise and bias due to lack/loss of calibration. The
method has also access to a few sparse but accurate BG reference measurements.
Moreover, we assume that CGM calibration times are known. The signals bgðtÞ
and cgmðtÞ are related by the model in Fig. 11.1 . The first block models the glucose
transport between blood and interstitial fluid with a two-compartment model
[15,16],
d
s igðtÞ¼ igðtÞþ bgðtÞ (11.1)
dt
where igðtÞ is the interstitial fluid glucose concentration and s is the diffusion time
constant assumed to remain constant between two consecutive calibrations. CGM
sensor measures glucose in the interstitial fluid producing a current signal, converted
back to a glucose concentration by calibration. Due to uncertainties in the calibration
process and to transduction sensitivity drifts, for sake of simplicity referred to as
Pre−processing Step: Outlier Detection
400 (Input) Raw CGM
(Input) Raw BG References
350 (Output) Outlier Free Signals
Concentration [mg/dl] 250
Test BG Reference
300
200
150
Unreliable Spike
100
Reference
Repeated Pressure Induced
50 Measurment Sensitivity Loss
18:00 00:00 06:00 12:00 18:00
Time [hh:mm]
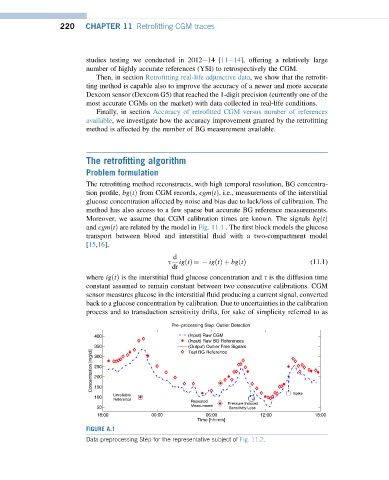
FIGURE A.1
Data preprocessing Step for the representative subject of Fig. 11.2.