
Page 245 - Glucose Monitoring Devices
P. 245
Results 249
Table 12.1 Johnson parameters of the recalibrated and synchronized
sensor error distribution.
Parameters Sensor error value
Family type Unbounded system
l 15.96
x 5.471
d 1.6898
g 0.5444
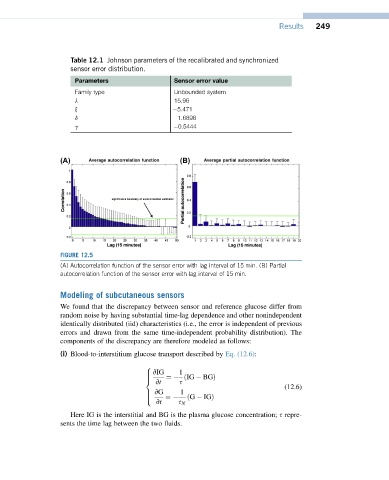
FIGURE 12.5
(A) Autocorrelation function of the sensor error with lag interval of 15 min. (B) Partial
autocorrelation function of the sensor error with lag interval of 15 min.
Modeling of subcutaneous sensors
We found that the discrepancy between sensor and reference glucose differ from
random noise by having substantial time-lag dependence and other nonindependent
identically distributed (iid) characteristics (i.e., the error is independent of previous
errors and drawn from the same time-independent probability distribution). The
components of the discrepancy are therefore modeled as follows:
(i) Blood-to-interstitium glucose transport described by Eq. (12.6):
8
> vIG 1
¼ ðIG BGÞ
>
vt
>
< s
(12.6)
> vG 1
>
¼ ðG IGÞ
>
vt s N
:
Here IG is the interstitial and BG is the plasma glucose concentration; s repre-
sents the time lag between the two fluids.