
Page 243 - Glucose Monitoring Devices
P. 243
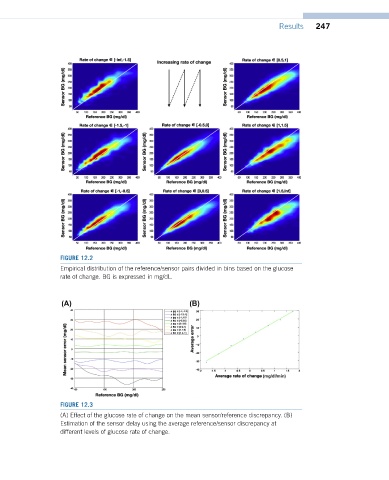
Results    247


                  FIGURE 12.2
                  Empirical distribution of the reference/sensor pairs divided in bins based on the glucose
                  rate of change. BG is expressed in mg/dL.


                  FIGURE 12.3
                  (A) Effect of the glucose rate of change on the mean sensor/reference discrepancy. (B)
                  Estimation of the sensor delay using the average reference/sensor discrepancy at
                  different levels of glucose rate of change.