
Page 244 - Glucose Monitoring Devices
P. 244
248 CHAPTER 12 Modeling the CGM measurement error
Characterization of recalibrated synchronized sensor errors
In this section, we study the third component of sensor difference from reference,
which remains after recalibration and synchronization of sensor and reference
data. We refer to this difference as the sensor error. To study more precisely the
sensor error and its time dependence, we used dataset 2, which contains YSI glucose
measurements taken at 15-min intervals.
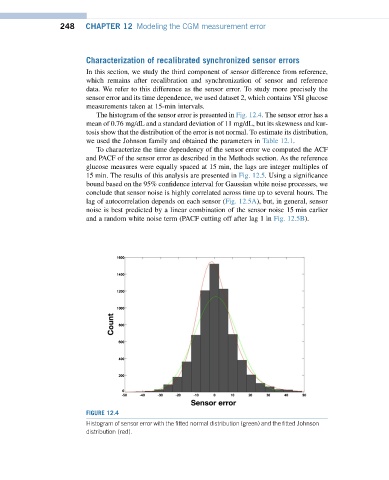
The histogram of the sensor error is presented in Fig. 12.4. The sensor error has a
mean of 0.76 mg/dL and a standard deviation of 11 mg/dL, but its skewness and kur-
tosis show that the distribution of the error is not normal. To estimate its distribution,
we used the Johnson family and obtained the parameters in Table 12.1.
To characterize the time dependency of the sensor error we computed the ACF
and PACF of the sensor error as described in the Methods section. As the reference
glucose measures were equally spaced at 15 min, the lags are integer multiples of
15 min. The results of this analysis are presented in Fig. 12.5. Using a significance
bound based on the 95% confidence interval for Gaussian white noise processes, we
conclude that sensor noise is highly correlated across time up to several hours. The
lag of autocorrelation depends on each sensor (Fig. 12.5A), but, in general, sensor
noise is best predicted by a linear combination of the sensor noise 15 min earlier
and a random white noise term (PACF cutting off after lag 1 in Fig. 12.5B).
FIGURE 12.4
Histogram of sensor error with the fitted normal distribution (green) and the fitted Johnson
distribution (red).