
Page 242 - Glucose Monitoring Devices
P. 242
246 CHAPTER 12 Modeling the CGM measurement error
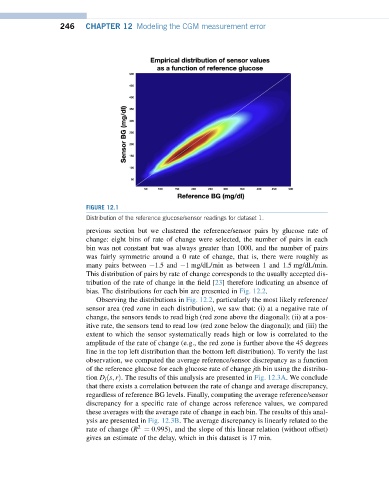
FIGURE 12.1
Distribution of the reference glucose/sensor readings for dataset 1.
previous section but we clustered the reference/sensor pairs by glucose rate of
change: eight bins of rate of change were selected, the number of pairs in each
bin was not constant but was always greater than 1000, and the number of pairs
was fairly symmetric around a 0 rate of change, that is, there were roughly as
many pairs between 1.5 and 1 mg/dL/min as between 1 and 1.5 mg/dL/min.
This distribution of pairs by rate of change corresponds to the usually accepted dis-
tribution of the rate of change in the field [23] therefore indicating an absence of
bias. The distributions for each bin are presented in Fig. 12.2.
Observing the distributions in Fig. 12.2, particularly the most likely reference/
sensor area (red zone in each distribution), we saw that: (i) at a negative rate of
change, the sensors tends to read high (red zone above the diagonal); (ii) at a pos-
itive rate, the sensors tend to read low (red zone below the diagonal); and (iii) the
extent to which the sensor systematically reads highorlow is correlatedtothe
amplitude of the rate of change (e.g., the red zone is further above the 45 degrees
line in the top left distribution than the bottom left distribution). To verify the last
observation, we computed the average reference/sensor discrepancy as a function
of the reference glucose for each glucose rate of change jth bin using the distribu-
tion D j ðs; rÞ. The results of this analysis are presented in Fig. 12.3A.Weconclude
that there exists a correlation between therateofchangeand average discrepancy,
regardless of reference BG levels. Finally, computing the average reference/sensor
discrepancy for a specific rate of change across reference values, we compared
these averages with the average rate of change in each bin. The results of this anal-
ysis are presented in Fig. 12.3B. The average discrepancy is linearly related to the
2
rate of change (R ¼ 0:995), and the slope of this linear relation (without offset)
gives an estimate of the delay, which in this dataset is 17 min.