
Page 106 -
P. 106
80 • Green Project Management
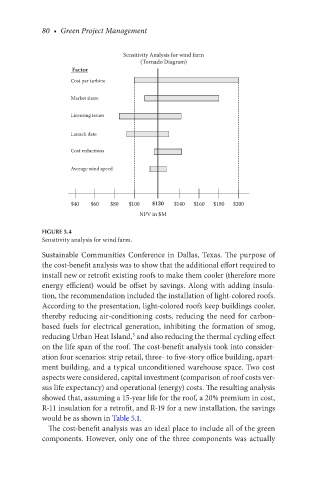
Sensitivity Analysis for wind farm
(Tornado Diagram)
Factor
Cost per turbine
Market share
Licensing issues
Launch date
Cost reductions
Average wind speed
$40 $60 $80 $100 $120 $140 $160 $180 $200
NPV in $M
Figure 5.4
Sensitivity analysis for wind farm.
Sustainable Communities Conference in Dallas, Texas. The purpose of
the cost-benefit analysis was to show that the additional effort required to
install new or retrofit existing roofs to make them cooler (therefore more
energy efficient) would be offset by savings. Along with adding insula-
tion, the recommendation included the installation of light-colored roofs.
According to the presentation, light-colored roofs keep buildings cooler,
thereby reducing air-conditioning costs, reducing the need for carbon-
based fuels for electrical generation, inhibiting the formation of smog,
reducing Urban Heat Island, and also reducing the thermal cycling effect
5
on the life span of the roof. The cost-benefit analysis took into consider-
ation four scenarios: strip retail, three- to five-story office building, apart-
ment building, and a typical unconditioned warehouse space. Two cost
aspects were considered, capital investment (comparison of roof costs ver-
sus life expectancy) and operational (energy) costs. The resulting analysis
showed that, assuming a 15-year life for the roof, a 20% premium in cost,
R-11 insulation for a retrofit, and R-19 for a new installation, the savings
would be as shown in Table 5.1.
The cost-benefit analysis was an ideal place to include all of the green
components. However, only one of the three components was actually