
Page 141 - Geology and Geochemistry of Oil and Gas
P. 141
112 NATURAL GASES AND CONDENSATES
+
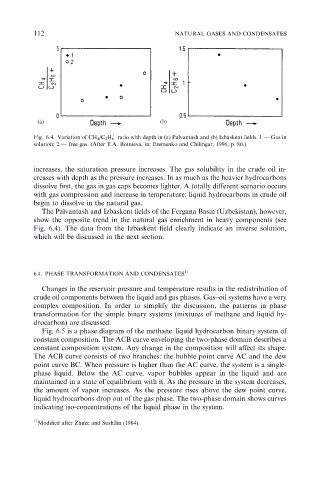
Fig. 6.4. Variation of CH 4 /C 2 H 6 ratio with depth in (a) Palvantash and (b) Izbaskent fields. 1 — Gas in
solution; 2 — free gas. (After T.A. Botnieva, in: Eremenko and Chilingar, 1996, p. 80.)
increases, the saturation pressure increases. The gas solubility in the crude oil in-
creases with depth as the pressure increases. In as much as the heavier hydrocarbons
dissolve first, the gas in gas caps becomes lighter. A totally different scenario occurs
with gas compression and increase in temperature: liquid hydrocarbons in crude oil
begin to dissolve in the natural gas.
The Palvantash and Izbaskent fields of the Fergana Basin (Uzbekistan), however,
show the opposite trend in the natural gas enrichment in heavy components (see
Fig. 6.4). The data from the Izbaskent field clearly indicate an inverse solution,
which will be discussed in the next section.
6.4. PHASE TRANSFORMATION AND CONDENSATES 11
Changes in the reservoir pressure and temperature results in the redistribution of
crude oil components between the liquid and gas phases. Gas–oil systems have a very
complex composition. In order to simplify the discussion, the patterns in phase
transformation for the simple binary systems (mixtures of methane and liquid hy-
drocarbon) are discussed.
Fig. 6.5 is a phase diagram of the methane–liquid hydrocarbon binary system of
constant composition. The ACB curve enveloping the two-phase domain describes a
constant composition system. Any change in the composition will affect its shape.
The ACB curve consists of two branches: the bubble point curve AC and the dew
point curve BC. When pressure is higher than the AC curve, the system is a single-
phase liquid. Below the AC curve, vapor bubbles appear in the liquid and are
maintained in a state of equilibrium with it. As the pressure in the system decreases,
the amount of vapor increases. As the pressure rises above the dew point curve,
liquid hydrocarbons drop out of the gas phase. The two-phase domain shows curves
indicating iso-concentrations of the liquid phase in the system.
11
Modified after Zhuze and Sushilin (1984).