
Page 143 - Geology and Geochemistry of Oil and Gas
P. 143
114 NATURAL GASES AND CONDENSATES
The additive rule is inapplicable for the calculations of p cr for gas–oil systems: p cr
of the mixture is usually much higher than p cr of any component. The greater the
difference in molecular mass and nature of the mixture components, the greater the
difference between the actual p cr and the p cr calculated using the additive rule.
All the above is true for a single equilibrium oil–gas system (in this case, methane-
liquid hydrocarbon). The situation drastically changes if the system is not in equi-
librium (for instance by increasing the molar fraction of methane). First of all, the
shape of the ACB curve (see Fig. 6.5) changes. Besides, the excess of methane forms
an independent gas phase (a gas cap at reservoir conditions). Thus, a transition may
be observed in the reservoir between the equilibrium gas–oil system and the gas cap.
This transition is gradual, with no distinct boundaries.
Numerous accumulations in West Siberia and North Caucasus, in terms of their
phase state, are within the curve ACB (see Fig. 6.5). It means that they are in a
transition vapor–liquid state, without a clear-cut gas–oil contact and gas cap (if it
exists). Such ‘‘transition type’’ accumulations, depending on their position within the
ACB curve, may be described differently on the basis of the well test results: (1) as
gas-condensate accumulations with or without an oil leg or (2) as oil accumulations
with a high gas/oil ratio (GOR) and a gas cap (with high condensate content), albeit
the presence of a gas cap may not be confirmed later. The OWC (the interface) may
be clearly definable at temperatures which are not high. At high temperatures (near
the critical temperature), a distinct OWC is replaced by a transitional water–oil zone.
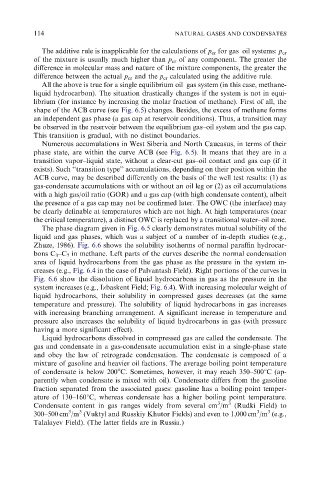
The phase diagram given in Fig. 6.5 clearly demonstrates mutual solubility of the
liquid and gas phases, which was a subject of a number of in-depth studies (e.g.,
Zhuze, 1986). Fig. 6.6 shows the solubility isotherms of normal paraffin hydrocar-
bons C 3 –C 7 in methane. Left parts of the curves describe the normal condensation
area of liquid hydrocarbons from the gas phase as the pressure in the system in-
creases (e.g., Fig. 6.4 in the case of Palvantash Field). Right portions of the curves in
Fig. 6.6 show the dissolution of liquid hydrocarbons in gas as the pressure in the
system increases (e.g., Izbaskent Field; Fig. 6.4). With increasing molecular weight of
liquid hydrocarbons, their solubility in compressed gases decreases (at the same
temperature and pressure). The solubility of liquid hydrocarbons in gas increases
with increasing branching arrangement. A significant increase in temperature and
pressure also increases the solubility of liquid hydrocarbons in gas (with pressure
having a more significant effect).
Liquid hydrocarbons dissolved in compressed gas are called the condensate. The
gas and condensate in a gas-condensate accumulation exist in a single-phase state
and obey the law of retrograde condensation. The condensate is composed of a
mixture of gasoline and heavier oil factions. The average boiling point temperature
o
of condensate is below 200 C. Sometimes, however, it may reach 350–5001C (ap-
parently when condensate is mixed with oil). Condensate differs from the gasoline
fraction separated from the associated gases: gasoline has a boiling point temper-
ature of 130–1601C, whereas condensate has a higher boiling point temperature.
3
3
Condensate content in gas ranges widely from several cm /m (Rudki Field) to
3
3
3
3
300–500 cm /m (Vuktyl and Russkiy Khutor Fields) and even to 1,000 cm /m (e.g.,
Talalayev Field). (The latter fields are in Russia.)