
Page 426 - Hacking Roomba
P. 426
Appendix B — Electrical Diagram Schematics 407
slightly different idiom for power and ground to match the Basic Stamp documentation. The
particular layout used is due to convention or author preference.
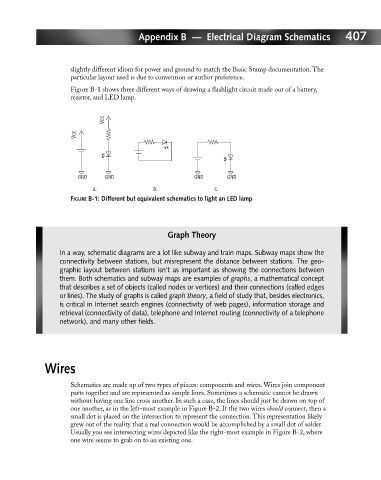
Figure B-1 shows three different ways of drawing a flashlight circuit made out of a battery,
resistor, and LED lamp.
Vcc
Vcc
GND GND GND GND
a. b. c.
FIGURE B-1: Different but equivalent schematics to light an LED lamp
Graph Theory
In a way, schematic diagrams are a lot like subway and train maps. Subway maps show the
connectivity between stations, but misrepresent the distance between stations. The geo-
graphic layout between stations isn’t as important as showing the connections between
them. Both schematics and subway maps are examples of graphs, a mathematical concept
that describes a set of objects (called nodes or vertices) and their connections (called edges
or lines). The study of graphs is called graph theory, a field of study that, besides electronics,
is critical in Internet search engines (connectivity of web pages), information storage and
retrieval (connectivity of data), telephone and Internet routing (connectivity of a telephone
network), and many other fields.
Wires
Schematics are made up of two types of pieces: components and wires. Wires join component
parts together and are represented as simple lines. Sometimes a schematic cannot be drawn
without having one line cross another. In such a case, the lines should just be drawn on top of
one another, as in the left-most example in Figure B-2. If the two wires should connect, then a
small dot is placed on the intersection to represent the connection. This representation likely
grew out of the reality that a real connection would be accomplished by a small dot of solder.
Usually you see intersecting wires depicted like the right-most example in Figure B-2, where
one wire seems to grab on to an existing one.