
Page 248 - Handbook Of Multiphase Flow Assurance
P. 248
Hydrate stability and crystal growth 247
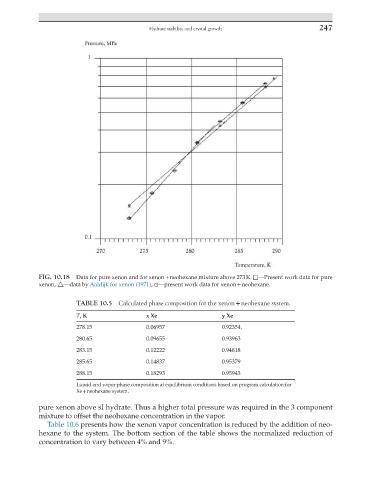
FIG. 10.18 Data for pure xenon and for xenon + neohexane mixture above 273 K. □—Present work data for pure
xenon, △—data by Aaldijk for xenon (1971), ⊙—present work data for xenon + neohexane.
TABLE 10.5 Calculated phase composition for the xenon + neohexane system.
T, K x Xe y Xe
278.15 0.06957 0.92354,
280.65 0.09655 0.93963
283.15 0.12222 0.94818
285.65 0.14837 0.95379
288.15 0.18293 0.95943
Liquid and vapor phase composition at equilibrium conditions based on program calculation for
Xe + neohexane system.
pure xenon above sI hydrate. Thus a higher total pressure was required in the 3 component
mixture to offset the neohexane concentration in the vapor.
Table 10.6 presents how the xenon vapor concentration is reduced by the addition of neo-
hexane to the system. The bottom section of the table shows the normalized reduction of
concentration to vary between 4% and 9%.