
Page 249 - Handbook Of Multiphase Flow Assurance
P. 249
248 10. Research methods in flow assurance
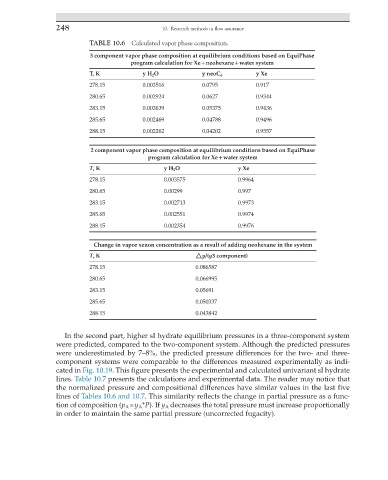
TABLE 10.6 Calculated vapor phase composition.
3 component vapor phase composition at equilibrium conditions based on EquiPhase
program calculation for Xe + neohexane + water system
T, K y H 2 O y neoC 6 y Xe
278.15 0.003516 0.0795 0.917
280.65 0.002924 0.0627 0.9344
283.15 0.002639 0.05375 0.9436
285.65 0.002469 0.04788 0.9496
288.15 0.002262 0.04202 0.9557
2 component vapor phase composition at equilibrium conditions based on EquiPhase
program calculation for Xe + water system
T, K y H 2 O y Xe
278.15 0.003575 0.9964
280.65 0.00299 0.997
283.15 0.002713 0.9973
285.65 0.002551 0.9974
288.15 0.002354 0.9976
Change in vapor xenon concentration as a result of adding neohexane in the system
T, K △y/(y3 component)
278.15 0.086587
280.65 0.066995
283.15 0.05691
285.65 0.050337
288.15 0.043842
In the second part, higher sI hydrate equilibrium pressures in a three-component system
were predicted, compared to the two-component system. Although the predicted pressures
were underestimated by 7–8%, the predicted pressure differences for the two- and three-
component systems were comparable to the differences measured experimentally as indi-
cated in Fig. 10.19. This figure presents the experimental and calculated univariant sI hydrate
lines. Table 10.7 presents the calculations and experimental data. The reader may notice that
the normalized pressure and compositional differences have similar values in the last five
lines of Tables 10.6 and 10.7. This similarity reflects the change in partial pressure as a func-
tion of composition (p A = y A *P). If y A decreases the total pressure must increase proportionally
in order to maintain the same partial pressure (uncorrected fugacity).