
Page 276 - Handbook Of Multiphase Flow Assurance
P. 276
Molecular modeling 275
molecules were standard for the SPC model. The whole system was electroneutral. Scaling of
the dielectric function was not used in this run in order to match the conditions of the pure
water simulation at 300 K. The potential energy of the whole system was minimized using
the Conjugate Gradient method. The simulation run included the equilibration for 10,000 fs in
microcanonical ensemble (NVE), 10,000 fs in canonical ensemble (NTV) to set the temperature
to 300 K, and 10,000 fs (NVE) steps. The data collection was made for the subsequent 90,000 fs
of the run in NVE ensemble.
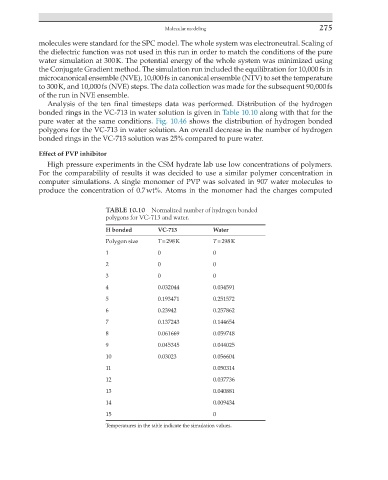
Analysis of the ten final timesteps data was performed. Distribution of the hydrogen
bonded rings in the VC-713 in water solution is given in Table 10.10 along with that for the
pure water at the same conditions. Fig. 10.46 shows the distribution of hydrogen bonded
polygons for the VC-713 in water solution. An overall decrease in the number of hydrogen
bonded rings in the VC-713 solution was 25% compared to pure water.
Effect of PVP inhibitor
High pressure experiments in the CSM hydrate lab use low concentrations of polymers.
For the comparability of results it was decided to use a similar polymer concentration in
computer simulations. A single monomer of PVP was solvated in 907 water molecules to
produce the concentration of 0.7 wt%. Atoms in the monomer had the charges computed
TABLE 10.10 Normalized number of hydrogen bonded
polygons for VC-713 and water.
H bonded VC-713 Water
Polygon size T = 298 K T = 298 K
1 0 0
2 0 0
3 0 0
4 0.032044 0.034591
5 0.193471 0.251572
6 0.23942 0.257862
7 0.137243 0.144654
8 0.061669 0.059748
9 0.045345 0.044025
10 0.03023 0.056604
11 0.050314
12 0.037736
13 0.040881
14 0.009434
15 0
Temperatures in the table indicate the simulation values.